Database Reference
In-Depth Information
PerformancePoint is directly aimed at the process of looking at a scorecard
and quickly identifying where a problem exists, and then exploring prebuilt
analysis paths to identify root causes of the problem.
Many people struggle
with trying to cus-
tomize Analytic Grids
to display data in a
format that can be
customized. Instead,
use scorecards to
gain control over the
display of your data.
Analytic grids are
simply an interactive
component rather
than a high-fidelity
display component.
A key point about PerformancePoint is that it is ideal for driving analysis from a
monitoring point of view, clicking on a value in a scorecard to change values in
associated charts and grids. It has the ability to have either a PerformancePoint
Analytic Chart or an Excel Services or Reporting Services report embedded
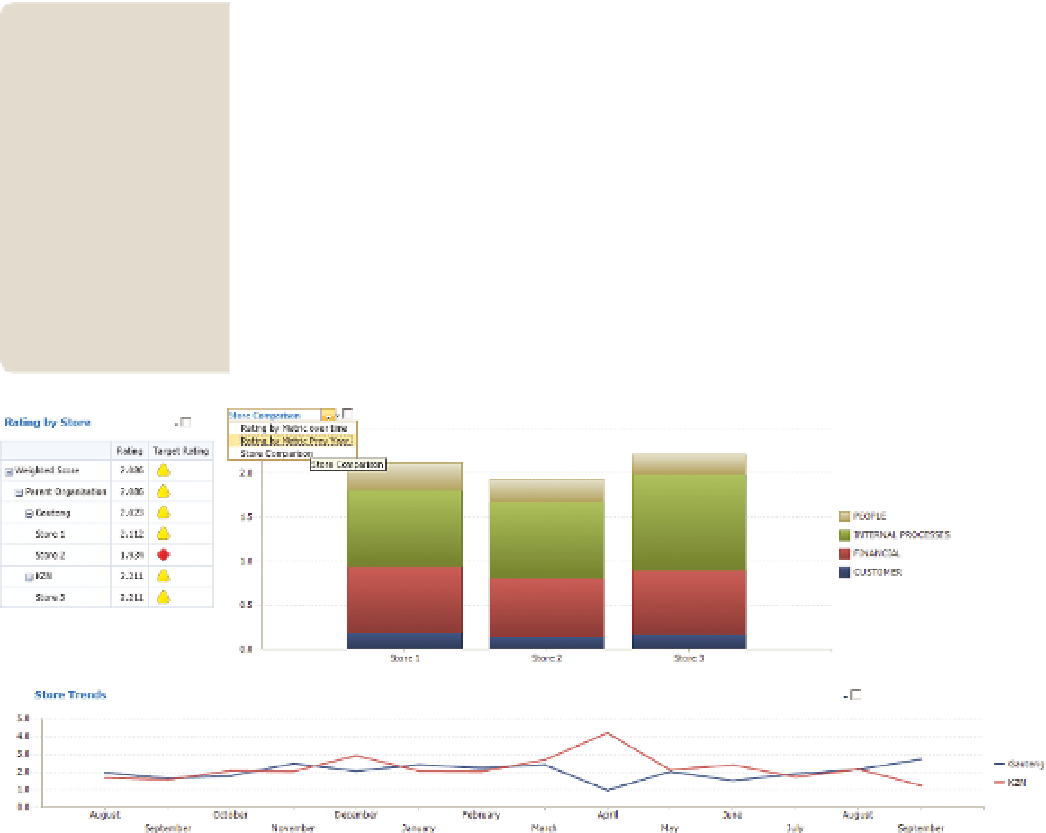
on the same page, and driven by the scorecard. Figure A-1 shows a mixture
of PerformancePoint components, a map created within Reporting Services,
and an Analytic Chart below. Clicking the scorecard updates the map as well
as the chart, and the chart allows for additional drilling down.
FIguR e A-1
PerformancePoint interactive dashboard
PerformancePoint is particularly poorly suited for printing, as the SharePoint
elements, such as navigation and the Ribbon, are typically also printed.
RePoRTIng SeRVICeS
Reporting Services is squarely aimed at the high-fidelity reporting audience.
It is more complex to develop than either PerformancePoint or Excel, and is
typically a developer function, even when using Report Builder, but offers a
level of control over the display not allowed in the other tools. A rather com-
plex but exceptionally powerful expression language enables a developer to
do exceptionally powerful conditional formatting.