Database Reference
In-Depth Information
uu
Chloropleth:
The different bounded areas are highlighted by changing
the shading or color to represent a value.
uu
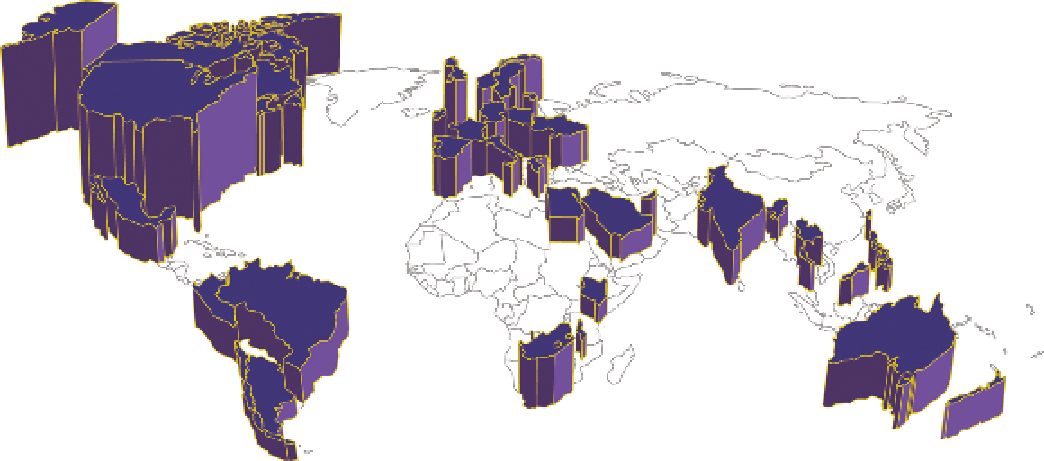
Prism map:
Similar to a chloropleth, but in 3D.
uu
Pin map:
Pins are shown on a map to highlight areas of interest.
uu
Combined chart maps:
Instead of pins, some other chart type, such as a
bar chart or pie chart, is shown to represent a value at that point.
Chloropleth and prism maps are often used for representing values such as
population density or voters, but they are also good for representing sales
or profitability in a state. The reporting services map shown in Figure 16-16
is a chloropleth, and Figure 16-17 shows a prism map. You can also see one
at
www.pwinfographics.net
.
F I g u R e 16 -17
A prism map
Pin maps are good for navigation and orientation. Although they are used to
represent data by having a variable number of pins, this is an inefficient use of
space, and pin maps are often unreadable when the volumes become too high.
Showing charts on a map is another usage that is inefficient—especially as
the prevalence is toward pie charts. The charts obscure the map itself, they
are often too small to read easily, and they are often poorly distributed and
obscure one another.