Database Reference
In-Depth Information
CHAP T ER 16
Other Visualizations
Throughout this topic you have learned about visualizations that you can
implement using the Microsoft stack, and how to implement them. In this chap-
ter you learn about other visualizations—many of these are not data-driven;
instead, they are often drawn by artists or handcrafted by other professionals.
TRADITIonAl
InFogRAPHICS
As discussed at length in Chapter 1, data driven
visualizations and infographics are very different in
function, and they are often different in form as well.
An infographic is typically static—in other words, if
the data changes, the infographic doesn't update.
Many infographics are simply images rather than
being interactive.
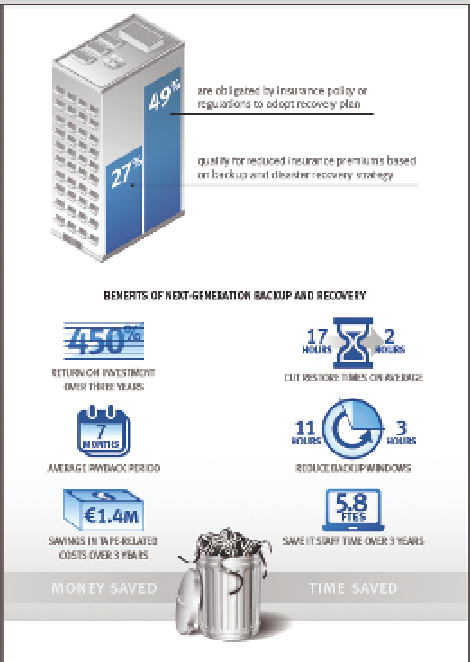
An infographic is often used to tell a single story,
with imagery chosen to it that story. It might have
numeric values attached to the images. An example
infographic is shown in Figure 16-1.
FI gu R e 16 -1
An infographic promoting next generation
backup and recovery