Database Reference
In-Depth Information
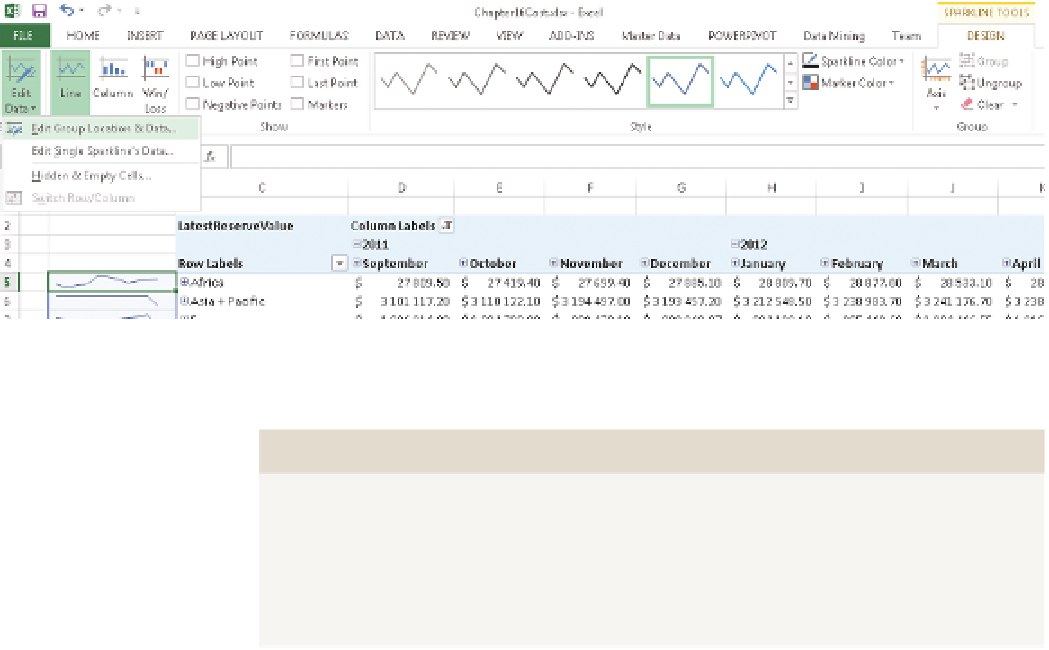
August 2012 in the tree, and deselect it. This distorts the sparkline, so when
you click the sparkline, a new context menu appears in the Ribbon, and you
can edit the data, as shown in Figure 15-24.
FI g u R e 15 -24
Changing sparkline data fields
mIssIng dATA
Missing data, such as that in this data set (there are data points missing
in June and July as well), is one of the larger problems with aggregating
large data sets. Using normalized aggregations such as arithmetic means
or metrics such as GDP per capita are often required when doing this sort
of analysis, rather than a pure SUM.
Another way of showing data is conditional formatting—the temptation is
to simply highlight the whole data set and add conditional formatting, but
doing this has a problem: the grand total will always be on one end of the
spectrum, and the smallest point of the data set the other. Comparing the
smallest country's reserve to that of all the OECD nations is not particularly
helpful unless it's expressed as a percentage.
Instead, you will apply conditional formatting to each level independently.
Start by clicking cell D5, choose conditional formatting in the Home Ribbon,
and choose the Green-White scale, as shown in Figure 15-25.