Database Reference
In-Depth Information
TABulAR DATA: ADDIng VISuAl ACuITy
The primary reason to add any sort of visualization to a table to is draw atten-
tion to particular rows, columns, or cells in the table; or alternatively to show
their relationship to other rows, columns, or cells. There are various ways of
doing this—in the old paper chart world, using a highlighter was the only
way, and this translates to the conditional formatting discussed in this chap-
ter. Several other ways of highlighting the relevant data points are those not
always traditionally thought of as visualization techniques—changing the
font of a cell, making it bigger, and using italics or bold is one method; and
adding borders is another. These small changes can make a huge difference
in the reading of a chart.
For this example, I will use a very common scenario—you need to present
a table of costs: to a potential client, your boss for budget approval, or pos-
sibly even at home while you decide on a holiday. In the following example,
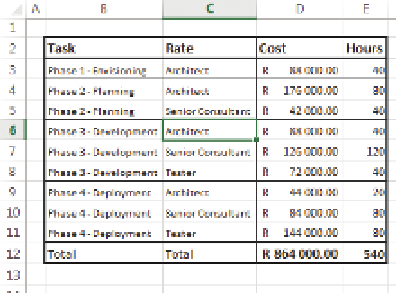
I use a fictitious consulting cost for a project, and the
unformatted table is in Figure 15-2.
A few very basic formatting techniques applied make a
huge difference in legibility: starting by sorting the data
in the order that it will be read—in this case, most likely
the task rather than the rate. Adding some white space
on top and to the left, and adding a border around the
entire cell with data will create the visual impression of
a discrete table rather than a set of data. Changing the
fonts to accentuate the important cells is important—in
this case, the headers along the top and the total value
are the most important, followed by costs and hours,
and then the descriptions last. Little formatting items
such as setting the currency are vital—without it, would
you have known that these figures were South African
rands and not U.S. dollars?
FI g u R e 15 -2
An unformatted table
Adding borders to separate the costs as well as the
phases will finish off the visual touches, as seen in
Figure 15 -3.
This is a much more legible chart, with only a couple of
touches, but what will make it more readable yet is to
include subtotals—in order to do that, we are going to
FI g u R e 15 -3
A formatted table of costs