Database Reference
In-Depth Information
// Add text to the labels.
// This method is only triggered on label creation
onCreateLabel: function(domElement, node){},
// Only used when Label type is 'HTML' or 'SVG'
// Change node styles when labels are placed
// or moved.
onPlaceLabel: function(domElement, node){}
});
// load JSON data.
sb.loadJSON(json);
// compute positions and plot.
sb.refresh();
First, a JSON object is obtained and then the new object is instantiated. The
outlines given here are the styling for the nodes, the edges, the labels, and
any events. (The events are how the lines are hidden when a node is clicked.)
onCreateLabel
and
onPlaceLabel
are internal workings and can mostly be
left alone. The library does the rest of the work.
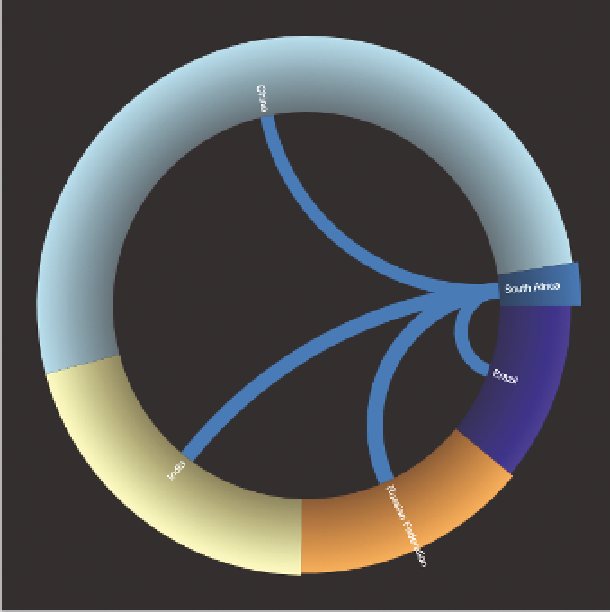
The end result is a graphic that, when it's been clicked, looks like the one in
Figure 14 -21.
Note that the log of the trade amounts was used to size the lines.
FI g u R e 14 -21
An InfoVis color wheel