Database Reference
In-Depth Information
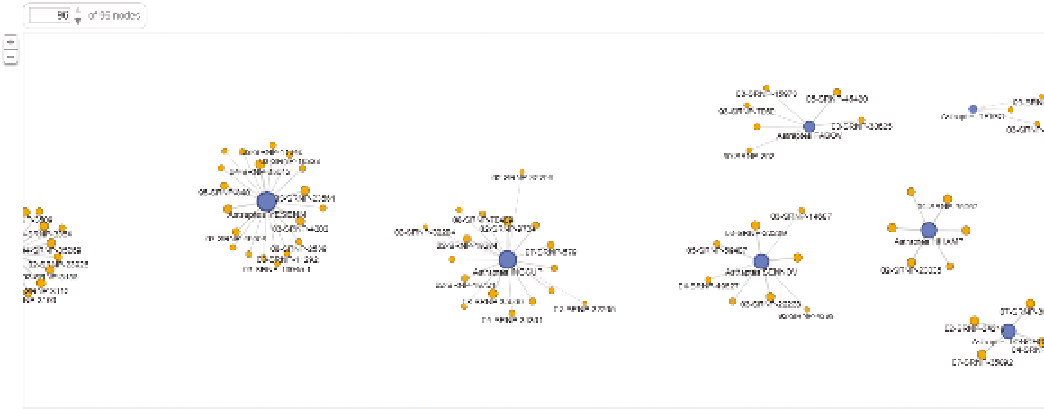
F I g u R e 14 -11
Networks built in Fusion Tables
IMPleMenTATIon eXAMPleS
The implementation examples use the OECD_Data model. You can obtain the
datasets from the Wiley website; see Chapter 3 for information about installing
them in the “Installing the Sample Databases” section.
BuILDING AN orGANIzATIoN CHArT IN PErForMANCEPoINT
To create custom visualizations in PerformancePoint, you use the Strategy
map feature, which requires you to first build a scorecard and then create a
Visio document to which you link the key performance indicators (KPIs) in the
scorecard. You can read about creating scorecards in Chapter 10.
In this example, you create custom rollups of OECD (Organization for Economic
Development) statistic metrics and associate them with organizations. The
organizations in this example are going to be our own creation, and this shows
the power of this approach in PerformancePoint. The data points you will
be using will be GDP per hour and Purchasing Price Parity in the Production
category, and Mean score in reading performance in the Education category.
In the PerformancePoint Content section of the Business Intelligence Center
in SharePoint, create a new PerformancePoint KPI in the Items section of the
ListTools tab in the Ribbon. This action launches the Dashboard Designer.