Database Reference
In-Depth Information
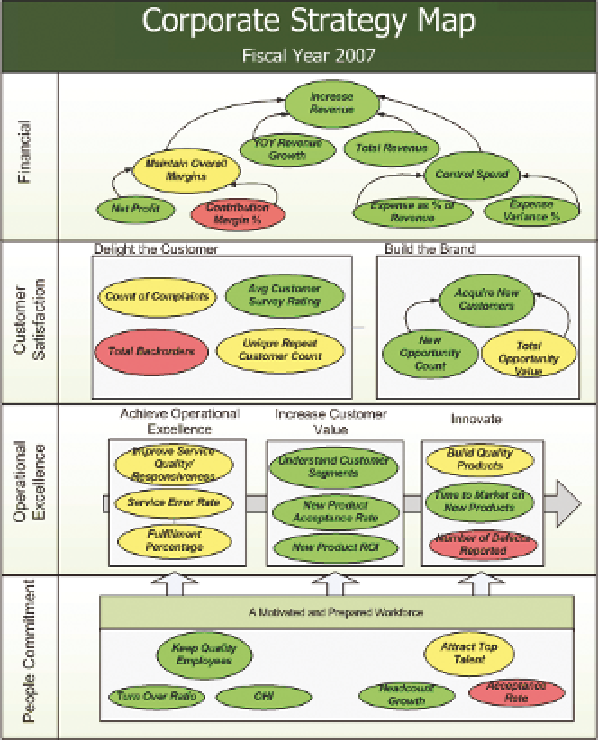
FI g u R e 14 -10
A balanced scorecard in PerformancePoint
More extensive use of this technology is great for visualizing flows such as
manufacturing processes. Because PerformancePoint strategy maps are based
on a user-customizable Visio diagram, almost any process can be visualized.
HTML5 STruCTurE MAPS
The biggest challenge with the NodeXL tool is that it is embedded only within
Excel. You can build a network map equivalent on the web using the same
libraries that we've been using and you were introduced to in Chapter 9, but
there are also some great online tools. You can see examples at
https://
www.google.com/fusiontables/Home/
.
The output of the network graph built in Fusion Tables is shown in Figure 14-11.