Database Reference
In-Depth Information
Start by opening up Dashboard Designer. If you have not used Dashboard
Designer before, you will open it up from the front page of a Business
Intelligence Center in SharePoint, choosing the Create Dashboard tab and
clicking Start using PerformancePoint services to bring up the Run Dashboard
Designer button. Set up the data connection and map the date dimension as
described in Chapter 7. Name the data connection
dsoECD
.
Right-click the List name (PerformancePoint content). Choose New
a
Filter
and then Time Intelligence Connection formula. Click OK.
Click Add Data Source; then choose the dsOECD data source. Click Next and
select the Time Intelligence Calendar. Click Finish and name the filter
Months
of f ye ar
.
Next, select PerformancePoint Content
a
New
a
KPI, and call the KPI
Average
Hours Worked Per year
. Change the number formats for both actual and
target from Default to Number, and remove the decimal spaces.
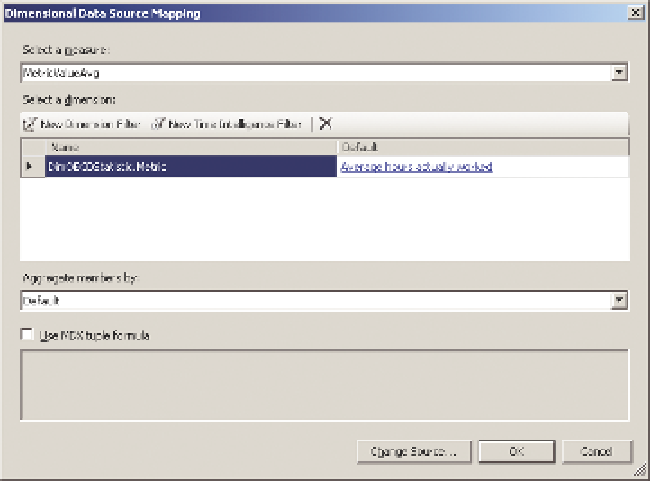
For the actual, click 1 (Fixed Values) under Data mappings; then change
the source to dsOECD and click OK. Choose MetricValueAvg under Select A
Measure; then click New Dimension Filter and choose DimOECDStatistic.met-
ric. Click OK, and choose Average Hours Actually Worked by clicking Default
Member (All) and selecting it from the list. Make sure to deselect the default.
Your setup should look like Figure 13-25.
F I g u R e 13-25
Setting up a measure in PerformancePoint Dashboard Designer