Database Reference
In-Depth Information
There are some very obvious limitations with this report—years are rolled up
months as opposed to the last value for the year, the formatting is not cor-
rect—but the obvious first issue is that the report is exceptionally slow and it
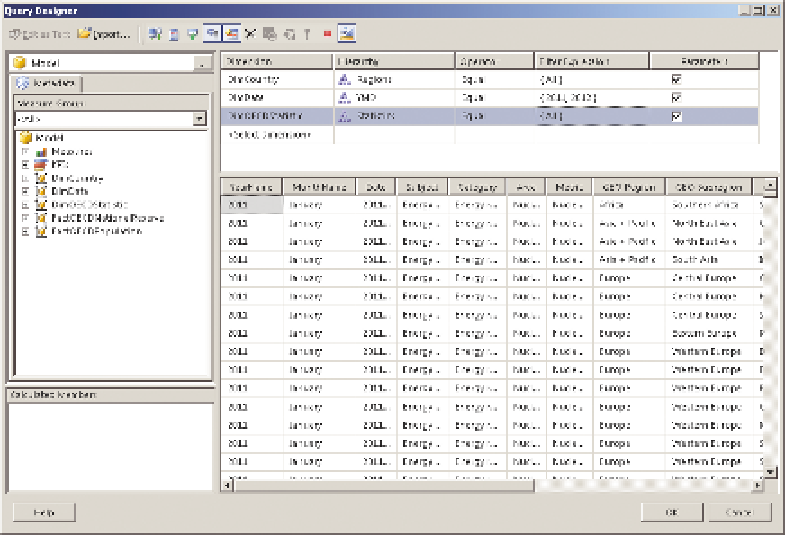
will always return all the data. To rectify these problems, go back to the data
set; add the Regions, YMD, and Statistics hierarchies to the filter; and click the
Parameterize button, as shown in Figure 13-22.
F I g u R e 13-22
The Query designer
This process enables you to parameterize the query and will serve as a basis
for connecting PerformancePoint to Reporting Services.
To finish this exercise, you will make the chart title dynamic and label the
axes correctly.
Start by right-clicking the Axis Title running along the left of the chart, and
clicking Axis Title Properties. Click the Fx button next to the chart title; then
replace the wording with
Parameters!yAxis.Label
, as shown in Figure 13-23.
The default, if you choose from the parameters at the bottom, will be Value,
but generally speaking, Labels will be more user-friendly.