Database Reference
In-Depth Information
F I g u R e 12 - 43
Inserting a gauge chart
Enlarge the row and column to make working easier, as shown in Figure 12-44.
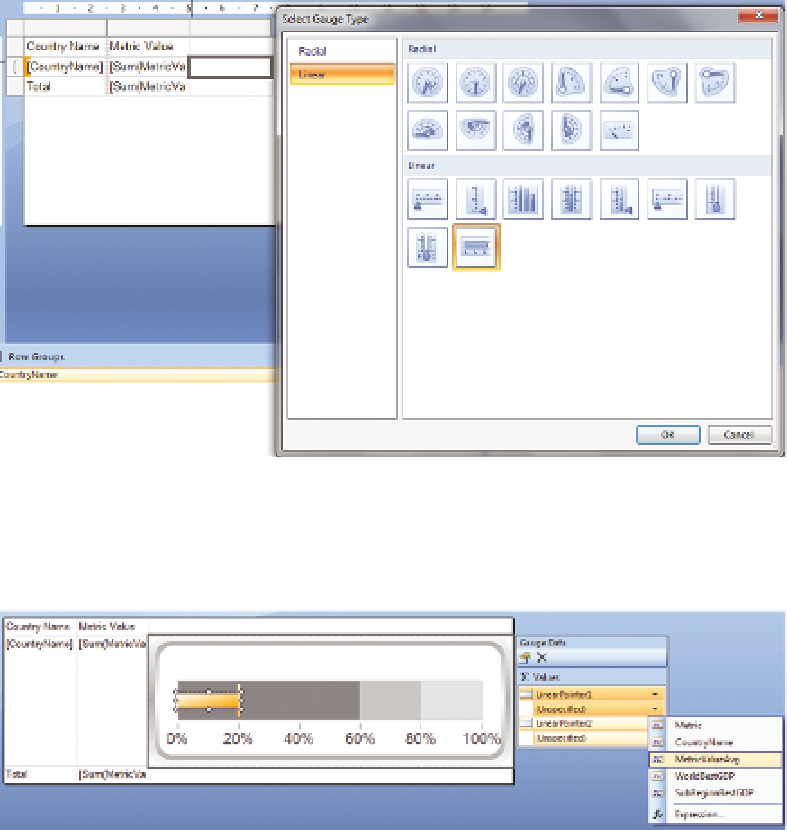
F I g u R e 12 - 4 4
Formatting the gauge chart
Right-click the gauge and choose Gauge Properties.
Select Back Fill and set it to solid and white. Click
the gauge, click the arrow next to Unspecified below
LinearPoint1, and set it to MetricValueAvg.
Repeat the process for LinearPoint2, and set it to
WorldBestGDP. To add another point, select the first
pointer on the graph, and then right-click just next
to it on the white space, as shown in Figure 12-45.
Set the third pointer to SubRegionBestGDP. Your
GDP values are not percentages, so right-click the
F I g u R e 12 - 45
Adding a pointer to a gauge chart