Database Reference
In-Depth Information
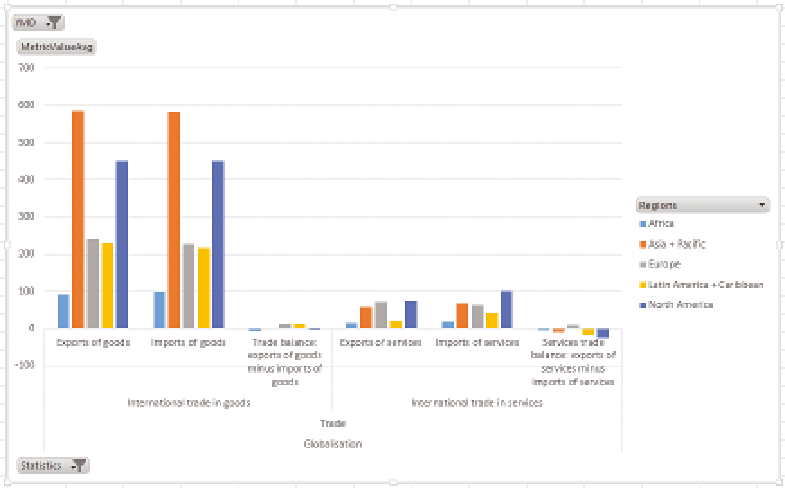
On your new pivot chart, add MetricValueAvg to the values and drag
DimDate
a
YMD to the filters. Add DimCountry
a
Regions to the Series, and
DimOECDStatistic
a
Statistics to the Axis.
On the pivot chart, click the drop-down arrow next to YMD and select 2011. Then
click the drop-down arrow next to Statistics and uncheck the Select All box.
Navigate to Globalisation
a
Trade
a
and select International Trade in Services
and International Trade in Goods and click OK.
Right-click Globalisation on the chart, choose Expand/Collapse, and then
choose Expand to Metric.
Your chart should look like Figure 12-38.
F I g u R e 12 -38
The basic chart before converting to a radar chart
To convert this to a radar chart, right-click the chart, choose Change Chart
Type, and then pick Radar chart from the list of charts, and click OK. Your chart
changes, as shown in Figure 12-39.
This chart is one that works better as a column chart. Give careful thought
before using radar charts.