Database Reference
In-Depth Information
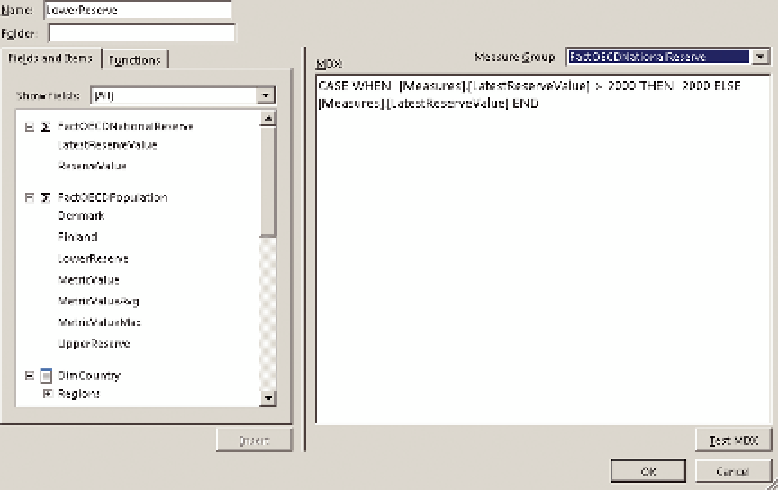
F I g u R e 12 -31
Calculated measure text
Next, create a new measure called UpperReserve in exactly the same manner
as LowerReserve. This value instead has a lower limit. Setting this lower limit
is crucial—any chart item with a value between the upper end of the Lower
value (2000) and the lower end of the Upper value disappears of the chart. In
this case, with just two values, you can be fairly arbitrary, and 150000 works.
Use the following code:
CASE WHEN [Measures].[LatestReserveValue] > 150000 THEN
[Measures].[LatestReserveValue] ELSE NULL END
The difference here is that the value at the bottom end is getting removed from
the chart. Add Upper Reserve to the chart and switch it to the secondary axis.
The trick is to set the minimum and maximum bounds of the axis so that it
appears above the other chart items. In this case, set the maximum to 200000
and the minimum to -228571 (-200000 plus an offset value of 1 seventh—you
often need to tweak this offset).
Your chart should currently look like Figure 12-32.