Database Reference
In-Depth Information
ExCEL: MuLTIPLE AxES AND SCALE BrEAKS
The implementation examples in this section use the OECDPopulation
PowerPivot model available from this topic's web page, and called
OECDPopulationStats.xlsx
.
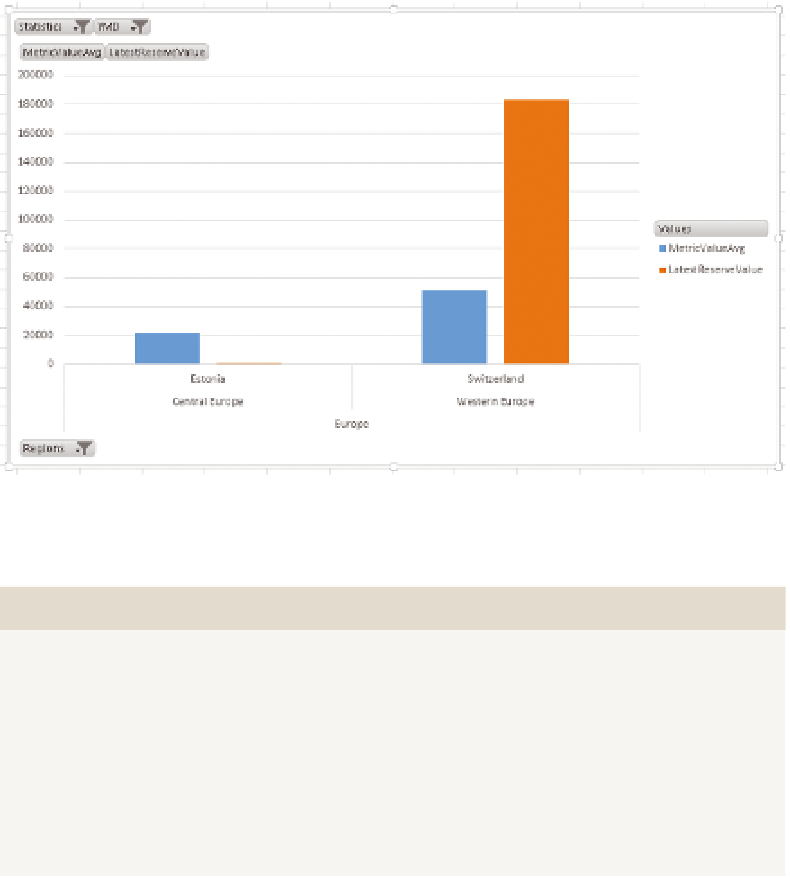
Sometimes it is difficult to show comparison for data—for instance, comparing
the GDP per capita to the National Reserve value, as they are substantially dif-
ferent values, or comparing two countries that are very different. For instance,
the chart shown in Figure 12-22 has these two measures for Switzerland and
for Estonia, and Estonia's Reserve value is barely visible:
F I g u R e 12 -22
An Excel chart with difficult-to-read figures
mulTIPle Axes Versus sCAle BreAKs
When two or more axes are shown together on a chart, the chart is said to
have
multiple axes
. These will be shown on each side of the chart, and the
series on the chart will be associated with one or the other of the scales.
A
scale break
is shown when, for example, only sections of a scale are
shown on the chart. For instance, a chart might only display values from
0-100 and 90000-100000. This enables a comparison of figures that are
different in scale.