Database Reference
In-Depth Information
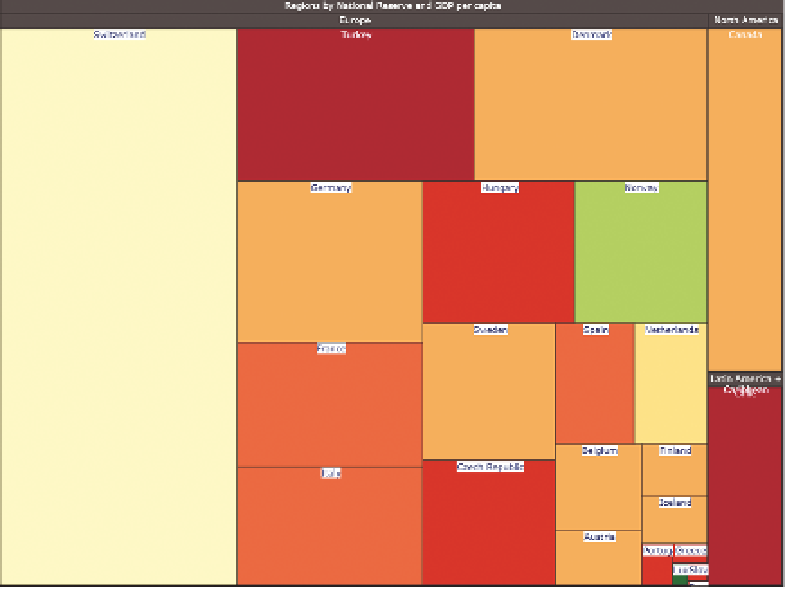
F I g u R e 12 -19
A heatmap built in InfoVis
IMPleMenTATIon eXAMPleS
The implementation examples in this section use the OECD_Data model, so
be sure you have downloaded those from this topic's web page on Wiley.com.
PErForMANCEPoINT: CoLuMN GrAPHS
PerformancePoint is the easiest tool to set up. To create the column chart
for this example, create a data source, as explained in Chapter 7, right-click
your PerformancePoint content list, and then create a new report. Choose
Analytic Chart from the window that appears and finish off by choosing your
data source. At this point you should see the Dashboard Designer window
like the one in Figure 12-20.