Database Reference
In-Depth Information
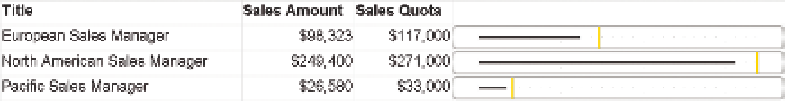
Figure 12-7 shows a basic example of a bullet chart.
F I g u R e 12 -7
A bullet graph in SSRS
Ease of Development
rEPorTING TooL
PrEDEFINED CHArT TyPE
EASE oF DEVELoPMENT
Excel
No
PerformancePoint
No
Power View
No
Reporting Services
No
Silverlight/HTML5
N/A
rADAr CHArTS
A radar chart is a way of comparing data along multiple axes. In a radar chart,
each point is represented as a distance from the center. The order and choice of
data points is quite important in this type of graph, as adjacent nodes should
be related in some manner, and the slope of the graph has meaning. In the
chart of education ratings for the Scandinavian countries shown in Figure 12-8,
the ratings for men and women have been chosen to be opposite each other,
allowing for each comparison, and science was picked to be between math
and reading, as science ability can be considered highly influenced by ability
in math and reading.
The high slope for women up to science versus the flat one for men is an
interesting contrast.