Database Reference
In-Depth Information
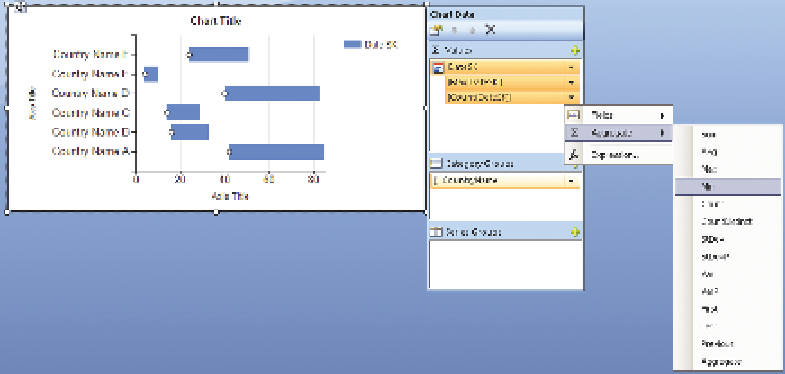
into the values column. Click the arrow next to the DateSK and choose Max
as the aggregation value.
On the next screen choose the Generic style and then click Finish.
When the chart appears on the report design surface, drag the bottom-right
corner to make the chart big enough to show all the values and then right-
click the chart and click Change Chart Type. Scroll to the bottom to find the
Range category. Choose the Range Bar chart type (it is fourth from the left).
Click the Low value that appears on the right side, and change it to use the
DateSK field and to aggregate as Min, as shown in Figure 11-43.
F I g u R e 11 - 4 3
Setting the DateSK field to aggregate as Min
Format the chart by right-clicking near the vertical axis (around the
CountryName labels). The words CountryName are repeated down the left
hand side, next to the words Axis title, and you need to click between two
of the lines containing CountryName. Then choose Vertical Axis Properties.
Set the interval to 1 from Auto to show all the countries. Set the Axis title at
the same time.
Next, right-click the bottom axis and select Horizontal Axis Properties. Deselect
the Always Include Zero button. Set the minimum value to
18232
(This is the
value of the first key in the data set, minus 30, to set the chart to display data
points prior to the start of the data set), and the maximum to
22281
(this is
the value of the last key in the data set), set the interval to 12, and then set