Database Reference
In-Depth Information
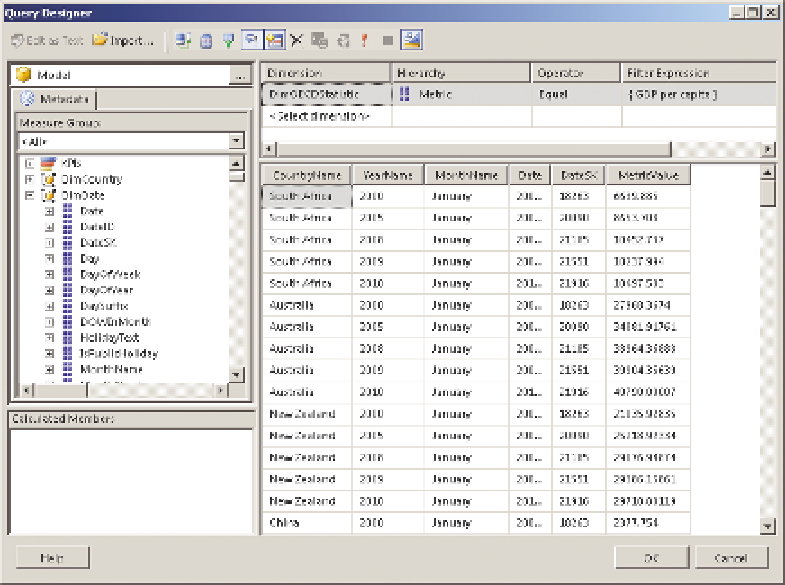
In this data set, filter by the GDP per Capita metric, and add the YMD hierar-
chy, the Country Name hierarchy, and the MetricValue measure to the design
surface, as shown in Figure 11-42. Add the DateSK column—this is an incre-
menting column that starts at 1 for the first date and has no gaps. It's ideal
for calculating distances on a chart.
F I g u R e 11 - 4 2
The Reporting services data set designer
This data set is going to be too large to work with easily, so filter it just for
South Africa and Canada. You do this by dragging CountryName onto the fil-
ter pane at the top on the right, and then choosing South Africa and Canada
from the drop-down. Click OK twice to close the designer when you're done.
You're just working on the chart, so remove the titleand footer from the report.
You remove the title by clicking on it, and then hitting the Delete key, and
you remove the footer by right clicking on it and choosing Remove footer.
Click the Chart option on the Insert tab, choose Chart Wizard, and in the
window that displays select the data set you just created. Click next. Choose
Bar, click Next, and then enter
CountryName
into the Categories and
DateSK