Database Reference
In-Depth Information
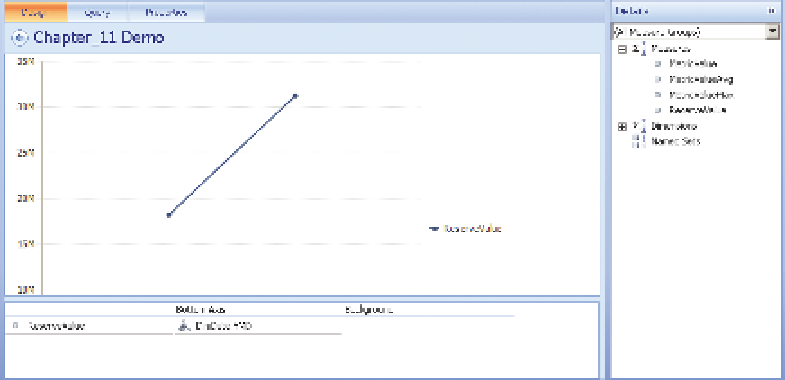
F I g u R e 11 - 41
A PerformancePoint analytic chart
Once deployed, this chart is automatically drillable by clicking on the year to
drill down to the months. You can create additional time series by using time
intelligence filters. In order to make it interactive with the other components
of PerformancePoint you need to add other dimensions to the background.
A DATA-DrIVEN TIMELINE uSING SSrS AND DATA BArS
SSRS can do all the visualizations that you have worked with so far this chapter
barring the animation, but it also has the capability of doing a timeline. This
isn't a standard visualization in SSRS, but it is relatively easy to do. You use
Report Builder to build the report, as described in Chapter 8. Start by creating
a data source connection to the OECD_Data tabular cube in Report Builder
and then creating a new data set.
To do so, open Report Builder and you will see the Getting Started Wizard.
Click on Chart Wizard, then click Next on the following screen. Click New to
create a new data source, then choose Microsoft SQL Server Analysis Services
from the Select connection type drop-down, and enter
rsds_oECDDatain
the
Name text box (this could be any name).
Click the Build… button. If you are using a local and unnamed Analysis Services
instance, you can just enter “
.
” in the Server name box, otherwise enter the
server you are connecting to. Finish off by choosing OECD_Data for the data-
base name, and clicking OK. Click OK again and then click Next to create the
data set.