Database Reference
In-Depth Information
F I g u R e 11 -2 9
Marking a table as a date table
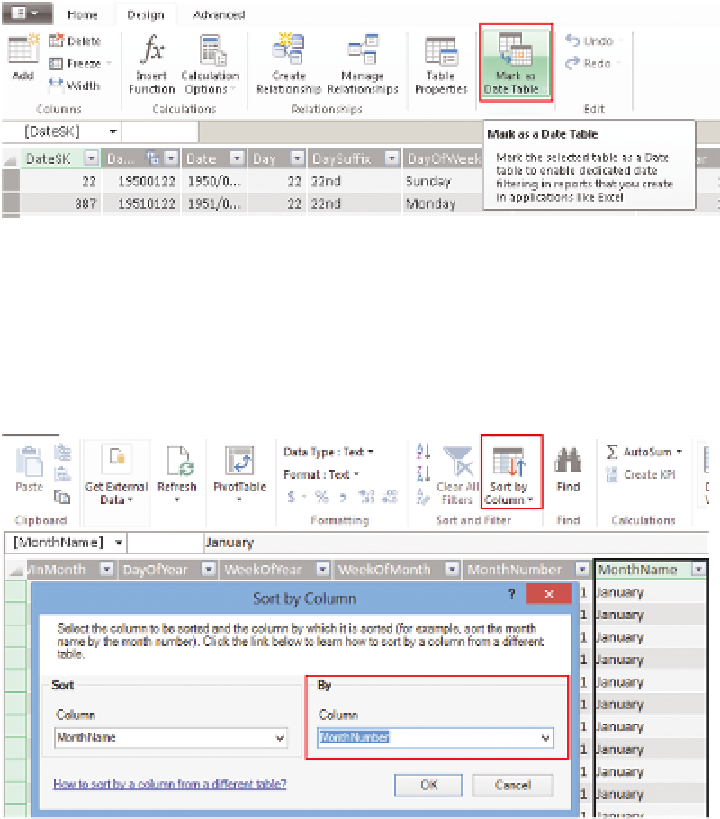
Click OK in the next window. You need to fix up the sorting of the Month
names by selecting the Month name column, and clicking Sort by Column on
the Ribbon's Home tab. Choose MonthNumber, as in Figure 11-30.
F I g u R e 11 - 3 0
Sort by columns
Repeat the process for MonthNameFull.
Next, you need to set the row identifier. The row identifier is similar to the
primary key in SQL Server, and is a number that uniquely identifies each row.
Start by enabling the advanced tab. This option is found under the file menu,
and is called Switch to Advanced Mode. Change to the Advanced tab, click
Table behavior, then select OECDPopulationID in the drop-down box for the
row identifier. Click the OK button.
Your final step is to create some measures that you are going to use in the
scatter plot. You need to create a measure for each dimension value you are
going to analyze. The three to analyze are Average Hours Actually Worked,
GDP per Capita, and GDP per Hour Worked.