Database Reference
In-Depth Information
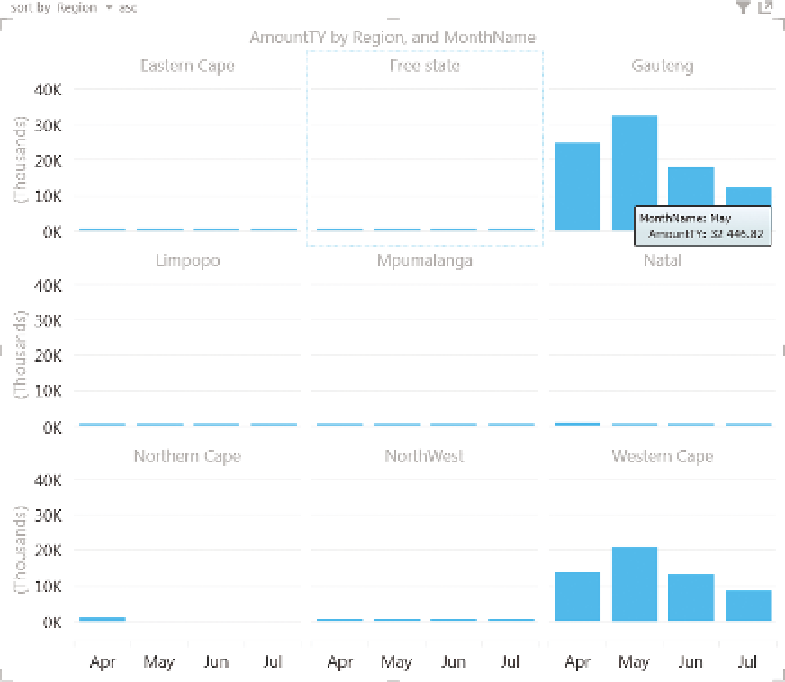
F I g u R e 11 -2 4
Power View tiled charts
Power View also has an animated scatter plot feature. This feature can't be
used in combination with tiling, but is as easy to implement. Simply create
a scatter plot chart and drag your date field to the Play Axis. The Play Axis
is a slider along the bottom of the chart which can be used to set a point
in time, or animate over the data points. Figure 11-25 shows a basic scatter
plot, and Figure 11-26 shows—as much as is possible in a static image—the
animation effects available. It is interesting to note how Power View shows
the track of a particular data series over time when it is clicked upon—a
very useful effect.