Database Reference
In-Depth Information
ExCEL
Excel's repertoire of line, column and scatter charts is very similar to SSRS when
it comes to temporal charts. Although the timeline capabilities are missing,
Excel has a very important addition known as trendlines, which are statistical
extrapolations of the trend of the chart series to date.
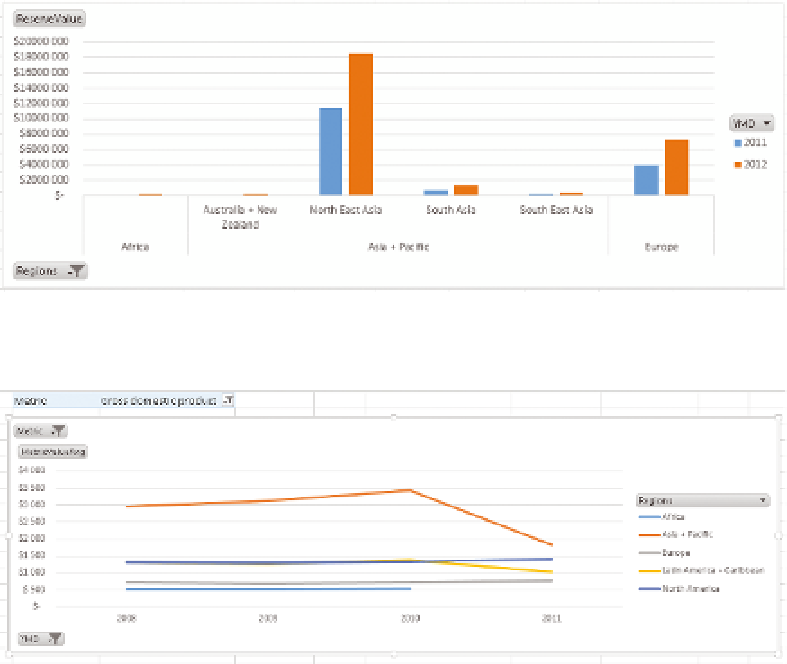
Examples of Excel column, line, and combined charts are shown in Figures
11-18 , 11-19 , a n d 11-2 0 .
F I g u R e 11 -18
An Excel column graph
F I g u R e 11 -19
An Excel line graph