Database Reference
In-Depth Information
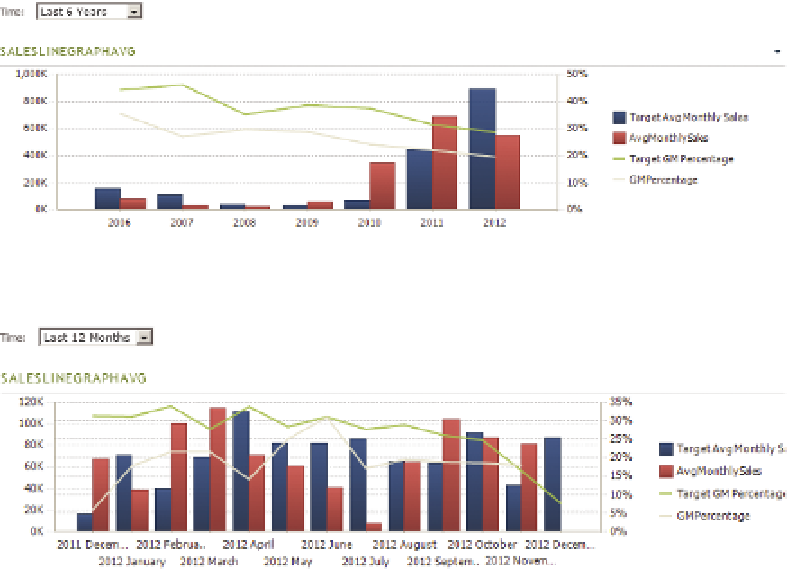
The combination of a Time Intelligence filter using STP formulae and a com-
bined line and column chart is very powerful. In Figures 11-10 and 11-11 you
can see how selecting a time period in the drop-down enables you to change
the connected graph
F I g u R e 11 -10
A PerformancePoint chart filtered by an STP formula
F I g u R e 11 -11
The same PerformancePoint chart filtered by a different formula
SQL SErVEr rEPorTING SErVICES (SSrS)
SQL Server Reporting Services (SSRS) enables you to have finely detailed control
over the individual elements in the charts being displayed. SSRS supports line
charts, column charts, combined line and column charts, bar charts, scatter
plots, and—with a bit of ingenuity—timelines. The only visualization missing
is the animation component.
Examples of SSRS column, line, and combined charts are shown in Figures
11-12 , 11-13 , a n d 11-14 .