Database Reference
In-Depth Information
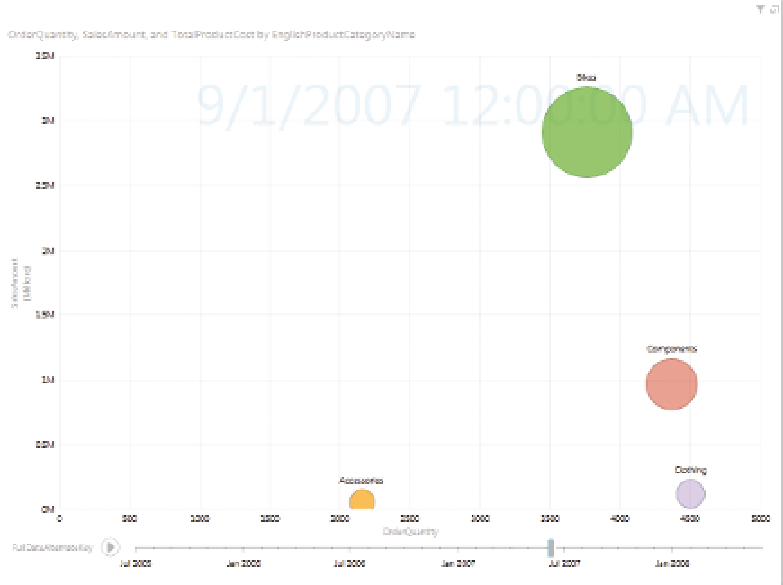
F I g u R e 11 - 6
A PowervView bubble chart
TILING
Tiles
are a series of similar charts, typically with one background filter applied
to the charts in a series. In the context of temporal analysis, the background
filter would be a discrete set of points in time, for example years or months.
This is a technique that can be applied in Reporting Services with some
amount of ease, by embedding a chart in a matrix, and PerformancePoint
has the capability of doing this specifically for pie charts (the only possible
advantage of having pie charts in PerformancePoint). However, the tool that
truly shines with tiling is Power View, in which you simply drag a value to the
Tile field to yield an exceptionally powerful visualization. The drawbacks of
tiling are, of course, that much more screen real estate is needed when charts
are repeated, and thus the charts themselves often end up smaller.