Database Reference
In-Depth Information
between different processes. Gantt charts are used to display dependencies
in the process on the timeline.
F I g u R e 11 -2
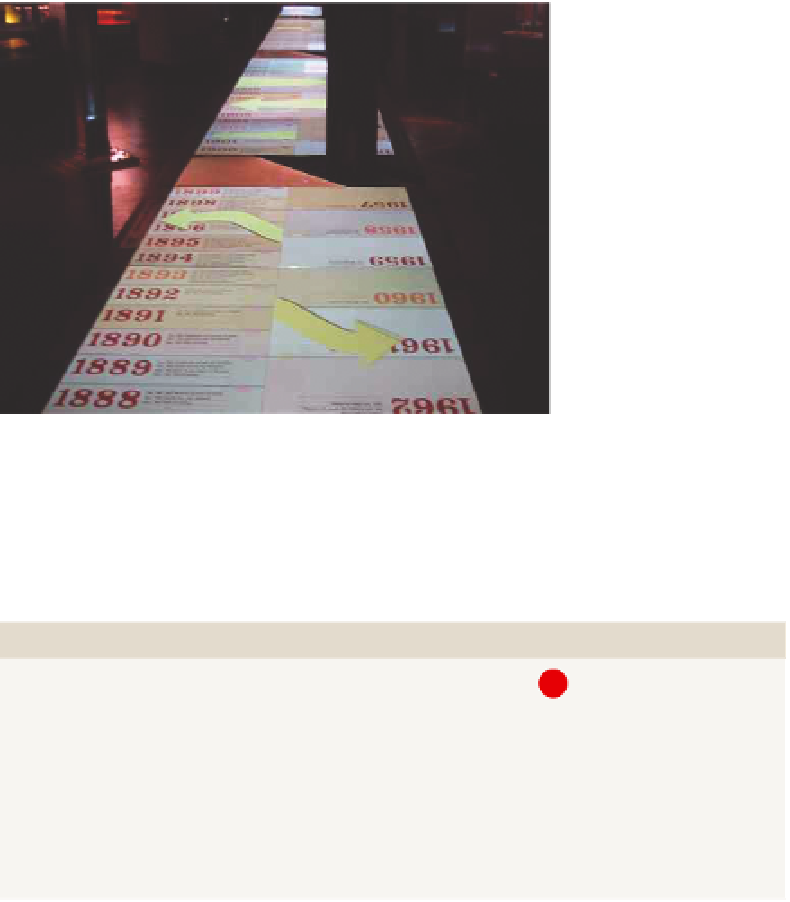
Another great example of the timeline is at the Impe-
rial War Museum in London, in the bunker—this timeline runs from
bottom to top, and interactively allows one to drill down into greater
detail of events.
Ease of Development
rEPorTING TooL
PrEDEFINED CHArT TyPE
EASE oF DEVELoPMENT
Excel
No
PerformancePoint
No
Power View
No
Reporting Services
No
Silverlight/HTML5
N/A
LINE CHArTS
Line charts are a very simple way of showing a value by positioning data points
on the vertical axis and drawing a line through the various points. If you plot
different data points this way, the various lines are called series. The relative
positioning of these lines enables you to easily make additional comparisons,