Database Reference
In-Depth Information
that they will be hidden when the scorecard is deployed on a dashboard. Save
your scorecard, go back to your deployed dashboard, and refresh it to see a
similar dashboard to the one in Figure 10-22.
Many times when
using conditional
formatting, you will
remove the actual
column and replace
the variance with the
actual value. This is
a good way to save
a lot of space—by
showing only a single
column, removing
the variance, and
using color instead of
an indicator.
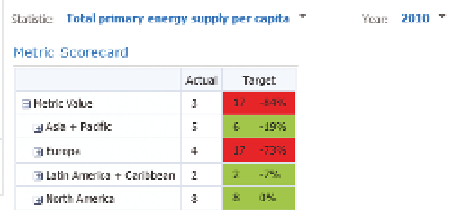
FIguR e 10 -22
A scorecard with conditional formatting
SuMMARy
In this chapter you learned the basic principles of using scorecards, and you
worked through the practical implementations in both PerformancePoint
and Excel. Scorecards are one of the most prevalent forms of business intel-
ligence deployed today, and knowing how to build them is an essential part
of your toolbox.