Database Reference
In-Depth Information
To finish setting up the Actual, click
the Default link under Calculation,
choose Average of Children, and
then click OK.
Be careful using the
Average of Children
rollup. It may lead
to a miscalculation
when you're doing
averages of averages.
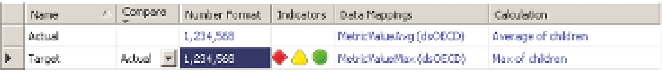
Now, map the Target metric in
exactly the same manner, but use
MetricValueMax for the measure and
Max of Children for the calculation.
Your screen should look like the one
shown in Figure 10-14.
Finish by naming your KPI Metric
Value and then saving it by right-
clicking on the KPI and clicking save.
F I g u R e 10 -13
Selecting a data source
FI g u R e 10 -14
A fully setup indicator
It's now time to create a scorecard: Right-click the PerformancePoint content
list and choose New
a
Scorecard. Choose a Blank Scorecard from the Standard
Scorecards category. Drag the KPI from the Details tab onto the left-hand
column labeled Drag KPI Items Here. Click the Update button on the Edit tab
of the Ribbon, and the scorecard displays as shown in Figure 10-15.
In the example in Figure 10-15, no values show because of the rollup up we
chose; as there are no children, and neither average nor max will work. Drag
the Regions hierarchy onto the Metric Value KPI so that the tooltip shows Last
Child, as shown in Figure 10-16. Release the mouse button.
Right-click the All member select Autoselect Members
a
Select Children, and
then click OK. Click the Update button in the Edit tab to see the result.
The current result showing on the scorecard is meaningless because it is a
rollup of all the indicators for all time. You are going to fix this by adding
two filters for year and statistic. Begin by renaming the scorecard as
Metric
Scorecard
and then saving it.