Database Reference
In-Depth Information
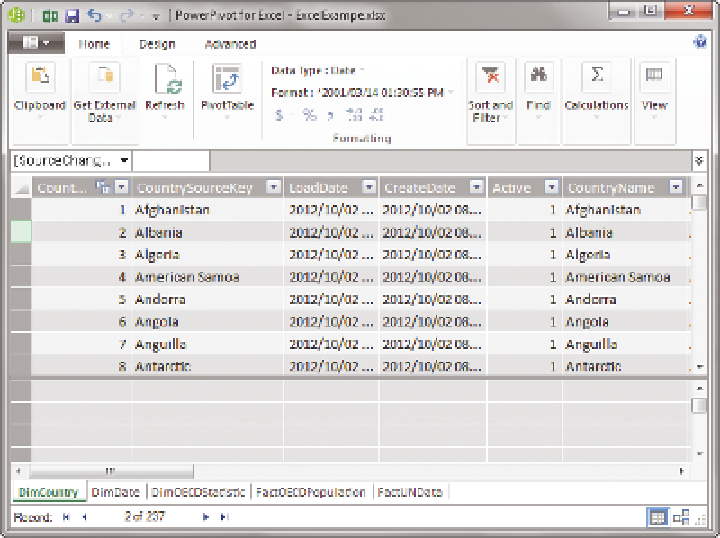
FIguR e 10 -8
A PowerPivot data set
For the target, you are going to compare each country against the best of its
peers. To do that, you are going to create a Data Analysis Expression (DAX)
calculation as a calculated column on FactOECDPopulation. The DAX code to
put into the column is:
=CALCULATE(
MAX(FactOECDPopulation[Value])
, FILTER (ALL(FactOECDPopulation), FactOECDPopulation
[DimOECDStatisticID] = EARLIER(FactOECDPopulation
[DimOECDStatisticID])
)
)
After this, create a SUM rollup on both the new column and on the actual,
which you will do by clicking the Sigma (sideways M) symbol on the Ribbon
while you have those columns highlighted.
Then click the measure you just created on the actual column, and click Create
KPI on the Home tab of the Ribbon. The pop-up box in Figure 10-9 appears.
Configure it to use your new measure as a target by selecting your new mea-
sure from the drop-down and set the red band to 40%, set yellow from 40%
to 80%, and set green above 120%.