Database Reference
In-Depth Information
The following is a list of some key design guidelines to work with in
PerformancePoint:
uu
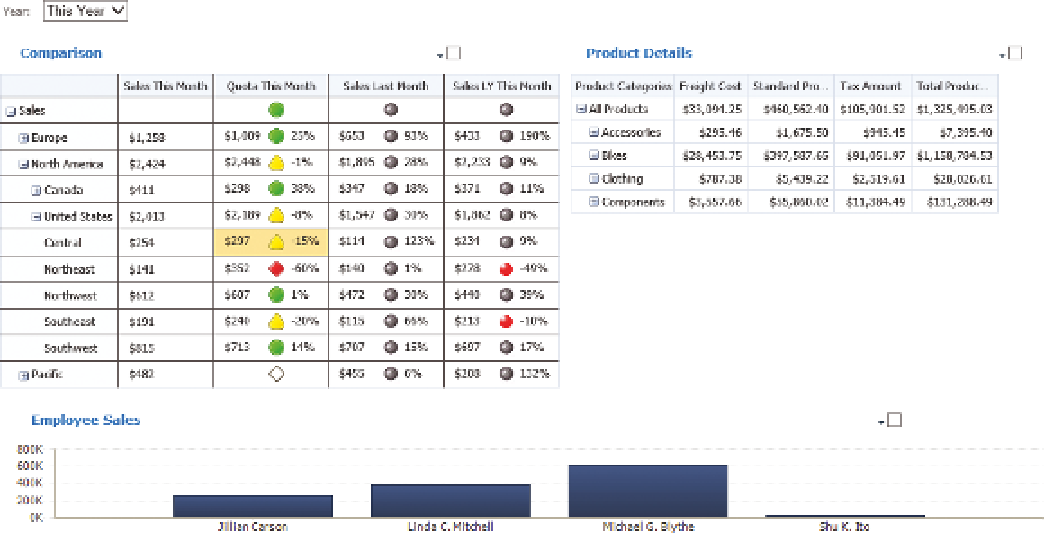
Keep filters along the top of the page.
uu
Keep a scorecard that controls other components on the left.
uu
Add additional items on the right side and at the bottom linked to the
scorecard.
Figure 10-5 shows an example of these.
FIguRe 10-5
Key design considerations in PerformancePoint
ExCEL
Excel in Office 2013 has become a very powerful dashboard tool. Although it has
some limitations compared to the power of PerformancePoint in terms of the
control over the connections, Excel still has a very simple and intuitive interface.
Excel includes KPIs, with the sole limitation that you must use the built-in icons.
PerformancePoint enables you to import your own indicators.
Excel is much more customizable than PerformancePoint when it comes to
appearance. You can fairly extensively customize a basic pivot table, as you
can see in Figure 10-6. When further customization is required, you can use
cube functions, which allow for total control, as you can see in Figure 10-7.