Database Reference
In-Depth Information
Tool CHoICeS, wITH eXAMPleS
Scorecards can be built with all of the Microsoft tools. PerformancePoint is
designed around scorecards, but with SQL Server 2008 R2, scorecard func-
tionality was added to Reporting Services. Excel has always been able to
build scorecards and indicators, but has had this functionality natively since
Excel 2010. In the following sections you learn in detail about the capabilities
of each tool.
PErForMANCEPoINT
PerformancePoint excels at scorecards, as it is aimed squarely at this segment
of BI. A key point, however, is that PerformancePoint works immensely better
when combined with Analysis Services or PowerPivot Services—the functional-
ity around analytic charts, hierarchies for drill down in scorecards—which are
all based upon having the semantic layer already built.
PerformancePoint dashboards can scale from the
simplest—a single traffic light visualization (red/
yellow/green) used on an operational page, as
shown in Figure 10-1—to a completely interactive
dashboard that has multiple pages, several filters,
a scorecard driving an analytic chart and another
scorecard, as shown in Figures 10-2, 10-3, and 10-4.
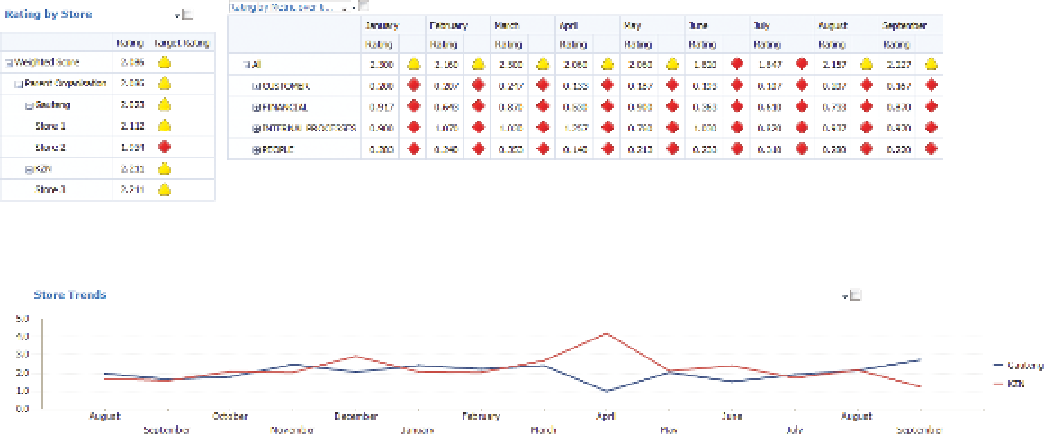
FIguR e 10 -1
A scorecard showing rollups of store scores
FIguR e 10 -2
The same dashboard but with the righthand scorecard switched for a chart