Database Reference
In-Depth Information
A scorecard, ultimately, is a special PerformancePoint report that can
include the following features:
uu
Status indicators showing a summary of the current actual per-
formance versus a targeted value
uu
Trend indicators showing how values have performed versus a
prior time period
uu
KPIs that measure performance comparing actual values with
desired target values
uu
Drill-down/drill-up navigation in order to see different levels of
detail by expanding or collapsing rows or columns
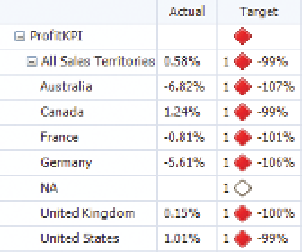
FIguRe 7-7
PerformancePoint
scorecard
uu
Time Intelligence for displaying dynamic time period values (e.g., Last
Two Q uar ters)
uu
Analysis of individual member contributions via a Decomposition Tree
uu
Filtering of other reports on the dashboard based upon the current selec-
tion within the scorecard
uu
Special filtering of top/bottom values
uu
Export to PowerPoint or Excel
uu
View information about a given KPI using a KPI details report
F I LT E r S
Enabling end users to target the data in which they want to analyze within
a dashboard is accomplish by designing PerformancePoint filters. Filters can
be classified as one of two types: dashboard filters and object filters. The
dashboard filters are separate PerformancePoint objects designed for use in a
single dashboard or across multiple dashboards. Object filters are found within
analytic reports and scorecards. It is important to note that a scorecard can
also be used as a filter for other dashboard objects on the scorecard.
Several types of dashboard filters are available, as follows:
uu
Member Selection: Uses Analysis Services or tabular dimension members
uu
MDX Query: Uses Analysis Services to form an expression
uu
Named Set: Uses Analysis Services items defined as a named set
uu
Time Intelligence: Enables specific preconfigured time filters specified
using Simple Time Period Specification (STPS) syntax