Database Reference
In-Depth Information
option is selected, and the KPI editor is then used to map the KPI to data
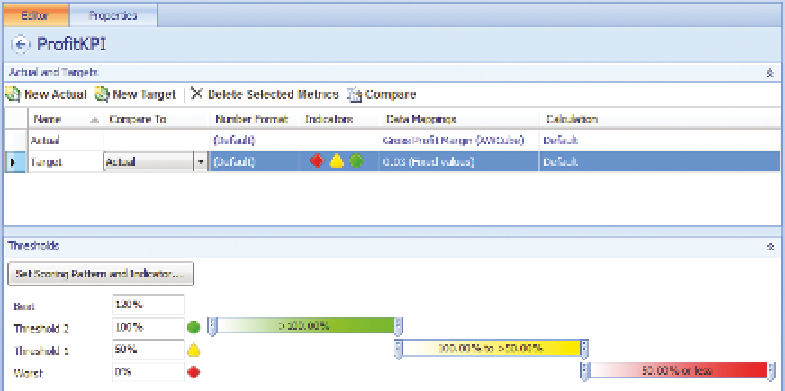
sources. Figure 7-5 illustrates a sample KPI being created by the KPI editor.
FIguRe 7-5
Creating a PerformancePoint KPI using the KPI editor
Configure the data sources for both actual and target rows within the KPI
editor by clicking the 1 (Fixed Values) link that is located within the Data
Mappings column. Note that the actual and target data mappings are con-
figured separately, so support is mapped to different sources. Multiple actual
and target values per KPI is available. This supports, as an example, the ability
to provide multiple period, actual and target evaluation of the KPI (e.g., Now,
This Month, This Year).
Selecting the proper scoring pattern and indicators involves editing a target
row within the KPI editor and setting the scoring pattern, banding method,
desired indicators, and worst value expected. Figure 7-6 demonstrates infor-
mation provided by the Edit Banding Settings editor within PerformancePoint.
The scoring patterns define whether a resulting value is considered a good
or bad score and include the following options:
uu
Increasing Is Better: No upper limit on what is considered good and larger
values are desired
uu
Decreasing Is Better: No lower limit on what is considered good and
smaller values are desired
uu
Closer To Target Is Better