Database Reference
In-Depth Information
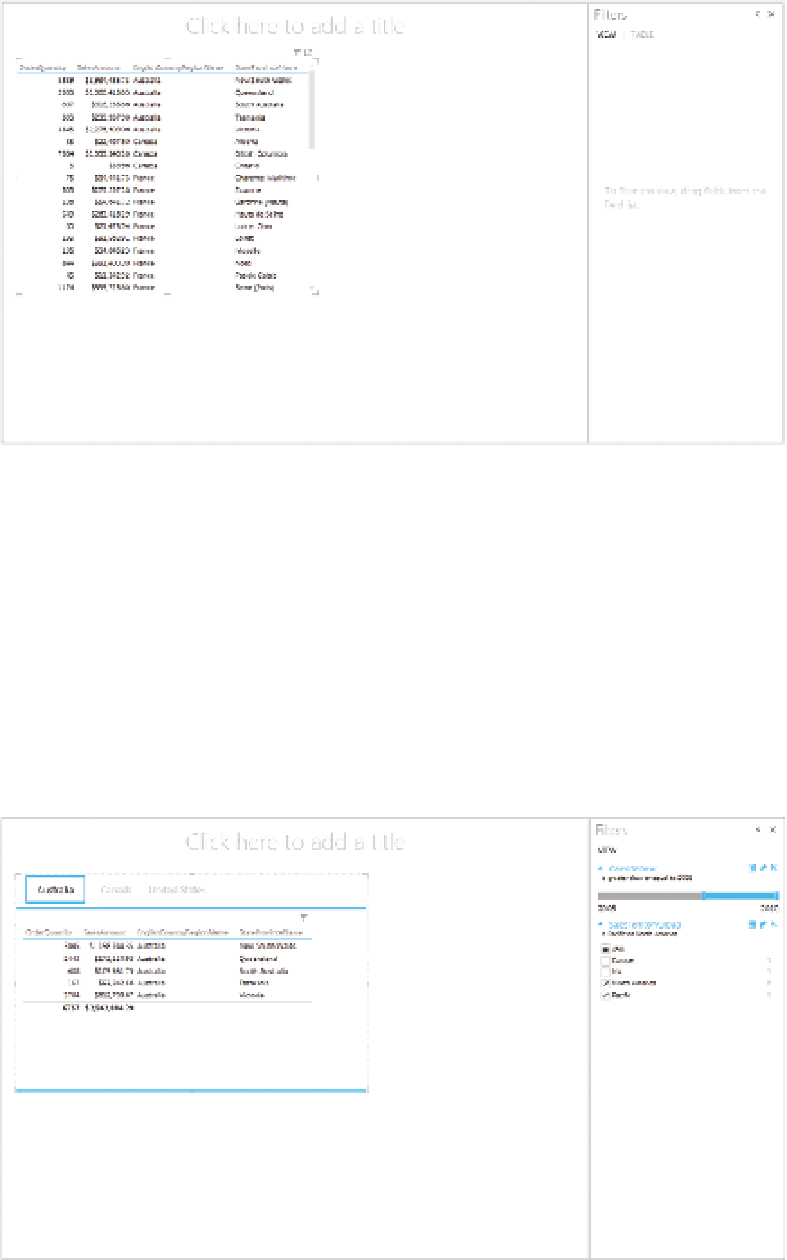
FIguRe 6-7
Your first table in a Power View report
4.
Click in the corners of the table and drag them to make the table more
readable. Get used to resizing these visualizations because you'll be
moving things around a lot to fit everything on the canvas.
5.
Now we can make this report even better by changing it to use tiles.
Click in the table and then go to the Design tab in the Ribbon. Click the
Tiles button and select Convert to use tiles. Now the report is tiled by the
region name, and you can click through the tiles in a visually appealing
manner. Your final report should look similar to that shown in Figure 6-8.
FIguRe 6-8
A Power View report with filters and tiles