Database Reference
In-Depth Information
CReATIng A PoweR VIew RePoRT
In this section you create a Power View report from scratch. This process
involves connecting to a deployed BISM tabular model and using that data
and functionality to drive the Power View experience.
CrEATING A DATA SourCE
Be sure to install the data samples for this chapter before beginning this
section. For more information, see the “Installing the Power View Samples”
section later in this chapter. The data sample files will be used to perform the
exercises in this chapter.
First, you need to create the data source. You can do this in one of several
ways. You can connect to your data model through Excel 2013 and import
the data into an Excel worksheet. Although this process will limit the amount
of data and functionality you can leverage, it is great for simple tasks. You
can use PowerPivot to import the data and then create tables in Excel to
analyze or you can connect to a PowerPivot data model that is published in
SharePoint. Right now, your data model is published to an Analysis Services
server somewhere, and that is the type of solution we're focusing on. For now,
let's jump into Excel.
CrEATING A NEW PoWEr VIEW rEPorT IN ExCEL
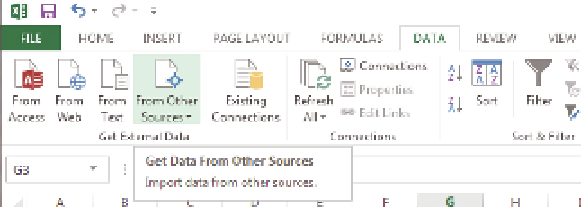
To create your new report, open Excel 2013 and select the Data tab. Then
select From Other Sources in the top-left third of the Ribbon. See Figure 6-4.
FIguRe 6-4
Getting external data from other sources