Database Reference
In-Depth Information
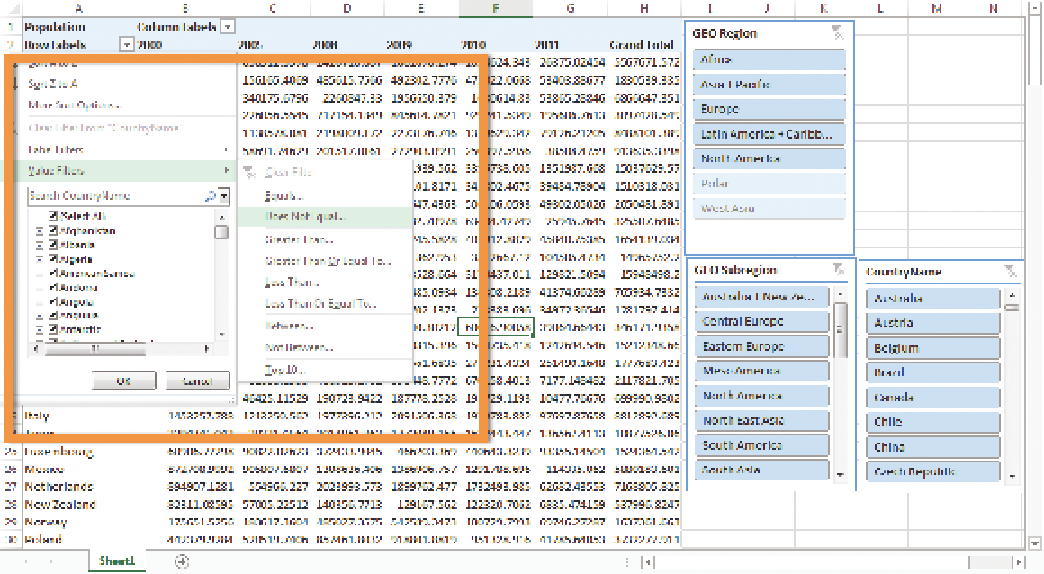
FIgu R e 5-21
A value filter
SuMMARy
This chapter covered some great ways to begin assembling data for analysis.
We covered the different ways we can use Excel and PowerPivot to build simple
models and tables to begin using them as baselines for visualizing our data
on top of them. You can now build a model, improve it and clean it up, and
begin visualizing it in Excel. In Chapter 6 you learn about bigger and better
models and visualizations using Power View.