Geoscience Reference
In-Depth Information
142°E
143°E
35°N
35°N
1
34°N
34°N
2
33°N
33°N
3
32°N
32°N
142°E
143°E
10000
9000
8000
7000
6000
5000
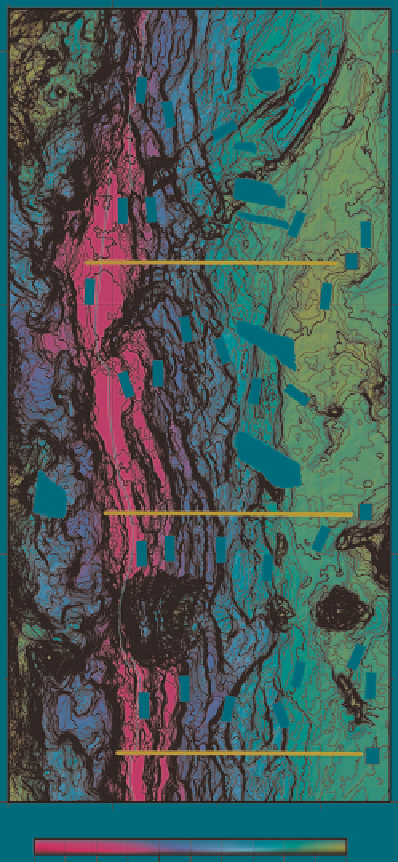
Fig. 16
Shaded bathymetric map of the northern Izu-Ogasawara Trench.
Red lines
show positions
of the profiles in Fig.
17
. Other conventions are identical to Fig.
7
trend N20-35°W, which is oblique to the strike of trench. Their coverage of
bathymetric data is only within 40 km from the trench axis. The bathymetric map
made in this study (Fig.
16
) displays a number of elongated escarpments and ridges.
The coverage of bathymetric data in this study is wider than in previous works
(Renard et al.
1987
). Bending-related topographic structures related with subduction
are limited to within 70 km from the trench axis (Fig.
17
). Topographic expression
Search WWH ::

Custom Search