Geoscience Reference
In-Depth Information
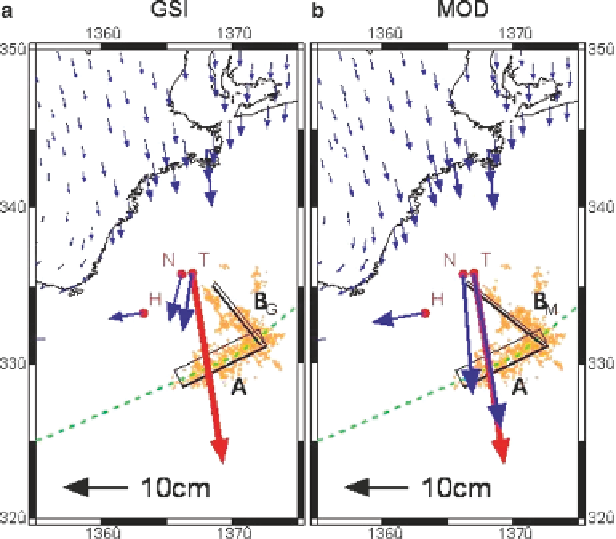
Fig. 1
Crustal movements detected by repeated GPS/Acoustic seafloor positioning (Kido et al.
2006
). The
red arrow
shows the average of the observed seafloor displacements, and
blue arrows
are calculated displacement vectors for fault models (
a
) from GPS observation on land (GSI
2004
)
and (
b
) from observation on land and seafloor.
T
,
N
, and H indicate seafloor stations of Tohoku
University, Nagoya University, and JHOD, respectively.
Orange dots
show aftershock activities.
Green dashed line
indicates the trench axis
is tilted by 10°, for example, horizontal position of the transducer shifts by some
10 cm; tilting of a benchmark results in an apparent crustal movement. This is a
serious problem underlying seafloor geodesy. It is so difficult to carry out a labora-
tory experiment to test the stability of PXPs above soft sediments. The big earth-
quakes occurred in 2004 near the seafloor arrays gave us a rare opportunity to
investigate the problem.
2
Diving Surveys
Three research groups had deployed 12 PXPs at three sites in Kumano-nada as
shown in Fig.
2
. We carried out visual inspection of ten of them in April 2006 dur-
ing the NT06-07 cruise of the JAMSTEC R/V Natsushima and the ROV (remotely
operated vehicle)
Hyper-dolphin
. This was the first diving survey to observe
seafloor benchmarks that experienced strong ground motion of earthquakes.
Photographs of all the instruments are shown below, because all of them are neces-
sary to estimate the stability of their attitude.
Search WWH ::

Custom Search