Geoscience Reference
In-Depth Information
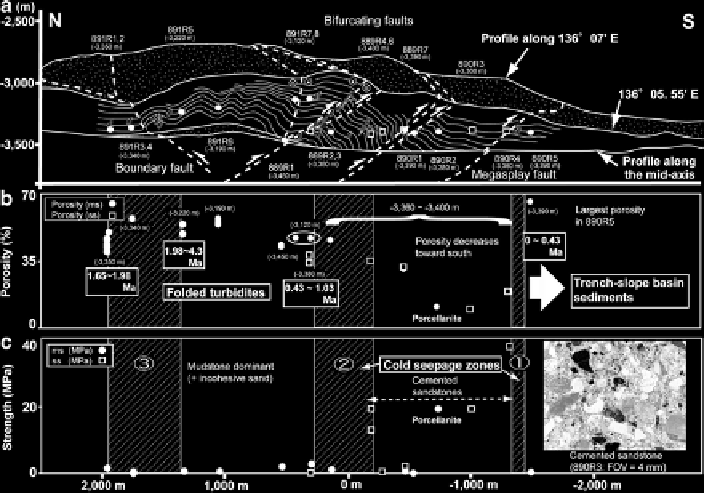
Fig. 7
Geologic cross section of the megasplay fault zone and distributions of material properties
(Data source; Anma et al.
2010
). (
a
) Pseudo-3D section across the 5th ridge. NS profiles along
136
o
07¢E and 136
o
05.55¢E, and along the mid-axis of the canyon are shown with bedding (
thin
lines
), distribution of faults (
dashed lines
), chemosynthetic bio-communities (shells and tube-
worms) and sample localities (
solid circle
: mudstone,
open square
: sandstone). Transverse axis
presents distance along the NS profile from the reference point on 33
o
01.6¢N. (
b
) Porosity profile.
Chemosynthetic biocommunities were observed in shaded area. Depositional ages are based on
radiolarian biostratigraphy in Fig.
8
. The porosity decrease has an almost negative correlation with
the depositional age, except for mudstone from 890R5 site in the southern end. (
c
) Uniaxial com-
pressional strength estimated from a needle penetration test. Sandstones in the south have high
strengths due to precipitation of carbonate (
inset
photo-micrograph) in pore space
4.4
The Megasplay Fault Zone: Material Properties,
Depositional Ages and Cements
Rock samples were collected from 22 sites to evaluate lateral variations of porosity,
strength and sediment textures along a NS profile across the megasplay fault zone.
To ensure to sample true horizontal lateral variations, samples were mostly collected
from 3,340-3,400 m below sea level (mbsl). Other samples were collected from depths
ranging from 3,120-3,450 mbsl (Fig.
7a
). Mudstones were mainly collected from the
rear part of the 5th ridge, whereas sandstones were mainly from the frontal part.
Lateral variations of porosity and uniaxial compressional strength of the collected
samples are shown in Fig.
7b, c
, respectively. A siltstone sample obtained from a
sub-horizontal bed at the 890R5 outcrop in the southernmost part of the transect has
Search WWH ::

Custom Search