Geoscience Reference
In-Depth Information
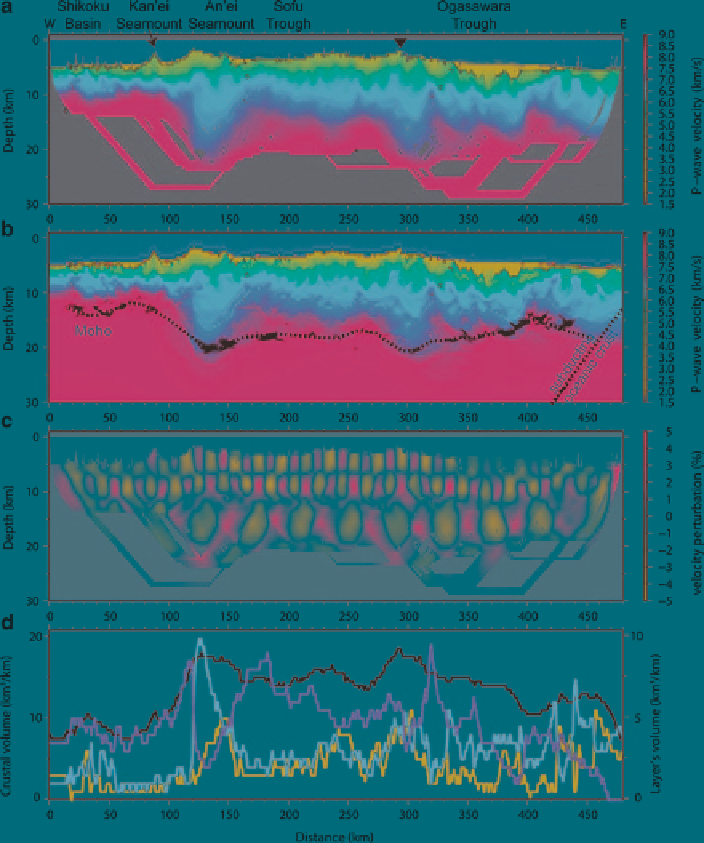
Fig. 3
Results of tomographic inversion for line IBr9. (
a
) Final
Vp
image.
Gray area
has too few ray
paths for resolution.
Black triangle
shows the volcanic front. (
b
) Reflective traces of Moho and the
top
of the Pacific plate mapped on the tomographic image. (
c
) Results of checkerboard test. (
d
) 2-dimensional
volumes of each crustal layer.
Black line
is profile of entire crust (
scale on left
);
blue, green, and red
lines
respectively indicate profiles of the lower part of the lower crust (
Vp
7.0-7.5 km/s), the upper part
of the lower crust (
Vp
6.5-7.0 km/s) and the middle crust (
Vp
6.0-6.5 km/s) (
scale on right
)
synthetic traveltimes were calculated with the same offsets as the real ones for the
picked first arrivals. Then, we performed a tomographic inversion using the syn-
thetic traveltimes and the initial model from the last inversion. We constructed
checkerboard patterns by subtracting velocities for the final model from those on
the model having perturbations. Test grids were 10 × 5 km down to 12 km depth,
and 20 × 10 km for depths below 12 km. This means that the
Vp
variation of the
Search WWH ::

Custom Search