Geoscience Reference
In-Depth Information
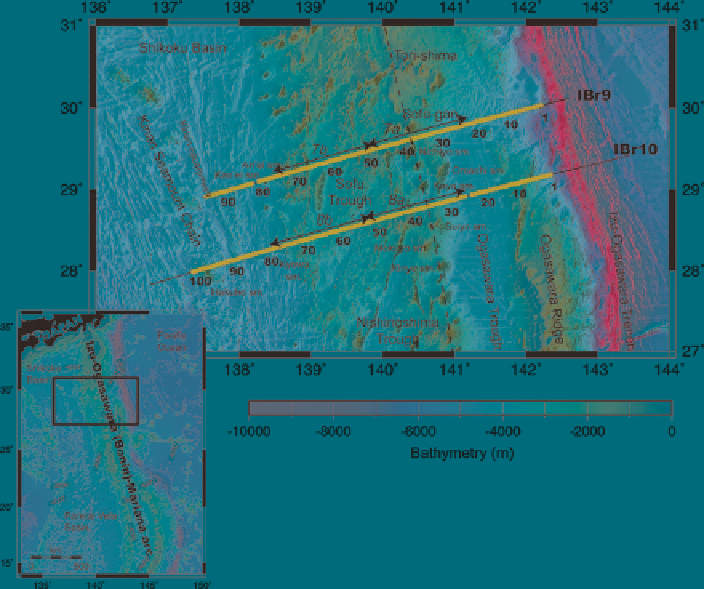
Fig. 1
Location of seismic lines IBr9 and IBr10 across the central Izu-Ogasawara arc.
Black
lines
indicate shot positions,
red circles
indicate OBS locations,
dashed line
indicates the
current volcanic front, and
numerals
indicate numbers of OBSs.
Lines with arrows
indicate
areas shown in Figs.
7
and
8
.
Inset
shows bathymetry of IBM arc and a
rectangle
indicating
the map area
In addition, we carried out MCS reflection surveys in 2006 and 2007. We used
the same airgun source and a 204-channel streamer, with total length of
approximately 5 km and with group interval of 25 m, installed on R/V
Kairei
(Kaiho et al.
2007
; No et al.
2008
). We used conventional procedures for data
analysis: amplitude recovery, minimum-phase conversion, predictive deconvolu-
tion, common midpoint (CMP) sort, dip moveout, velocity analysis, normal move-
out correction, CMP stacking, and Kirchhoff time migration. The reflection
sections are of good quality, confirming shallow sedimentary structures and defor-
mation. We traced the shape of the basement bathymetry and incorporated it into
the
Vp
models.
All OBSs were equipped with three-component geophones (vertical and two
perpendicular horizontal components), using gimbal mechanisms and a hydro-
phone sensor. Natural frequencies of the geophones were 4.5 Hz. Our OBSs were
originally designed by Kanazawa and Shiobara (
1994
), and the digital recorder
with a 16-bit analog-to-digital converter was developed by Shinohara et al. (
1993
).
In this study, the sampling interval was 10 ms.
Search WWH ::

Custom Search