Environmental Engineering Reference
In-Depth Information
(a)
(b)
(d)
(c)
(e)
(f )
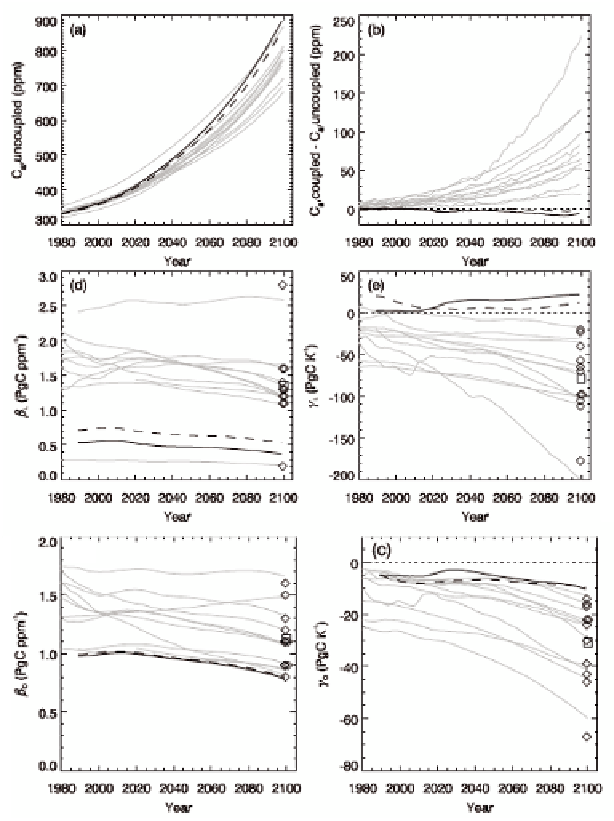
FIGURE 2.10 Predicted atmospheric CO
2
and climate-carbon cycle feedback parameters. (a) Atmospheric
CO
2
trajectories for simulations with the same prescribed fossil fuel emissions and no CO
2
-radiative feed-
backs. (b) Difference in atmospheric CO
2
due to radiative coupling. (c) Land biosphere response to in-
creasing atmospheric CO
2
. (d) Land biosphere response to increasing temperature. (e) Ocean response to
increasing atmospheric CO
2
. (f ) Ocean response to increasing temperature. Gray lines show results from
carbon-only model studies from Friedlingstein et al. (2006) (also reported in IPCC, 4th assessment). Thick
black lines are from a nitrogen-carbon model (Thornton et al., 2009a); thick solid line for pre-industrial
nitrogen deposition and thick dashed line for anthropogenic nitrogen deposition. Diamonds show the
feedback parameters estimated at year 2100 for previous studies (Friedlingstein et al., 2006), and squares
show their mean. Thin dotted lines indicate zero response. (adapted from Thornton et al., 2009a).