Environmental Engineering Reference
In-Depth Information
Decline rate 3.5% per year
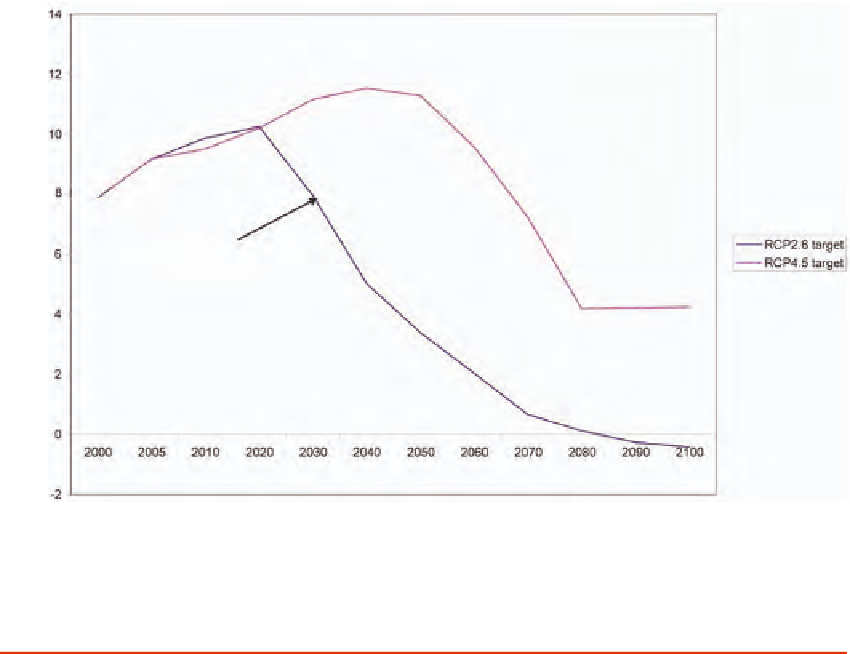
FIGURE 2.6 shows representative carbon pathways (RCPs) for limiting radiative forcing (W per m
2
) at two
alternative levels. The tighter the limit, the earlier the reductions must take effect. With the RCP 2.6 scenario,
the rate of growth first slows and then rapidly declines beginning in 2020. In the case of the less stringent
constraint, emissions rise for another two decades before peaking. Here the decline is shifted out in time.
carbon budget and a greater array of low-carbon, economically competitive
alternatives, which are assumed to become available in the future.
We stress that there is a great deal of flexibility regarding the rate at
which new technologies are substituted for existing ones, both on the sup-
ply and demand sides of the energy sector. The rate of retirement of existing
carbon-intensive plant and equipment and their replacement with more
climate-friendly alternatives will depend upon a number of factors. These
include the stabilization target, reference case emissions in the absence
of a price on CO
2
(either explicit or implicit), the availability and costs of
alternatives, and the
willingness
to pay the costs of the transition to a low-
carbon economy. The latter will depend on society's perception of the ben-
efits (reduction in damages due to climate change). From a purely physical
perspective, decline rates much higher than those shown here are feasible.
It is a matter of the perceived urgency and the motivation to decarbonize.