Environmental Engineering Reference
In-Depth Information
BOX 2.1 STABILIZATION AND NON-CO
2
GREENHOUSE GASES
Because carbon emissions reductions of more than 80% are required to stabilize carbon dioxide
concentrations, small continuing emissions of carbon dioxide, or emissions of CO
2
-equivalent
through other gases, could have surprisingly important implications for stabilizing climate
change. For example, emissions of the hydrofluorocarbons (HFCs) currently used as substitutes
for chlorofluorocarbons make a small contribution to today's climate change. However, because
emissions of these gases are expected to grow in the future if they are not mitigated, and be-
cause of the stringency of the requirement of near zero emissions of CO
2
-equivalent, these gases
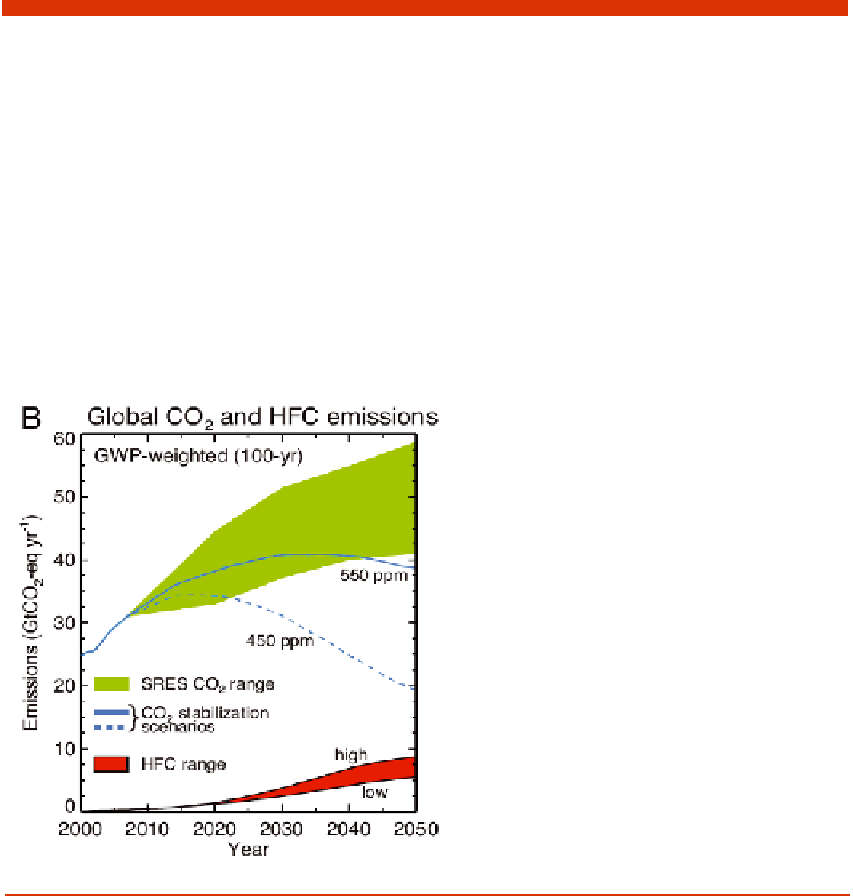
could represent a significant future impediment to stabilization efforts. For example, Figure 2.4
below shows that in the absence of mitigation, the HFCs could represent as much as one-third
of the allowable CO
2
-equivalent emissions in 2050 required for a stabilization target of 450 CO
2
-
equivalent. Thus, the analysis presented here underscores that stabilization of climate change
requires consideration of the full range of greenhouse gases and aerosols, and of the full suite
of emitting sectors, applications, and nations.
FIGURE 2.4 Global CO
2
and HFC emissions ex-
pressed as CO
2
-equivalent emissions per year for
the period 2000-2050. The emissions of individual
HFCs are multiplied by their respective GWPs (di-
rect, 100-year time horizon) to obtain aggregate
emissions across all HFCs expressed as equivalent
GtCO
2
per year. High and low estimated ranges
based on analysis of likely demand for these
gases and assuming no mitigation of HFCs are
shown. HFC emissions are compared to emissions
for the range of SRES CO
2
scenarios, and two 450-
and 550-ppm CO
2
stabilization scenarios. The es-
timated CO
2
-equivalent emissions due to HFCs in
the absence of mitigation reach about 6 GtCO
2
-
equivalent in 2050, or about a third of the emis-
sions due to CO
2
itself at that time in the 450
ppm stabilization scenario. Source: Velders et al.
(2009).
tion, due to the irreversible character of the induced warming driven by
carbon dioxide (see Section 3.4).
2.2 INFORMATION FROM SCENARIOS
Figure 2.5 shows the emissions of manmade greenhouse gases from
various sectors of the U.S. economy (U.S. EPA, 2008). For highly industri-