Environmental Engineering Reference
In-Depth Information
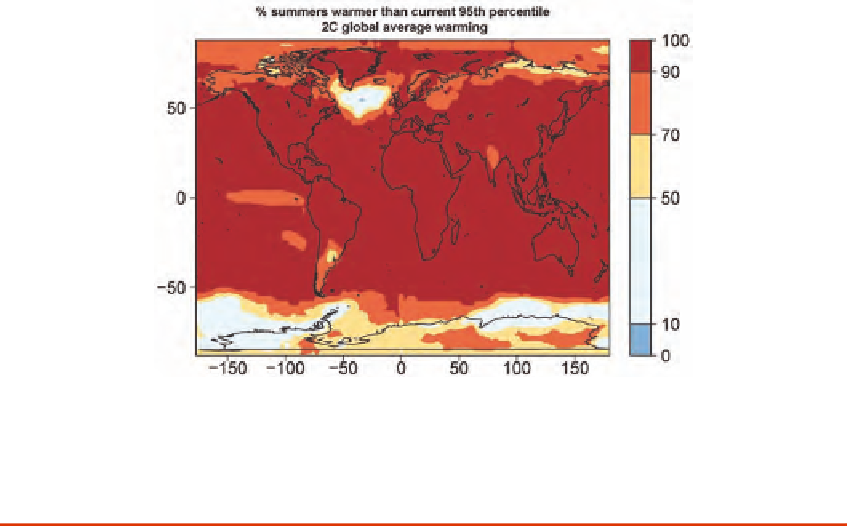
FIGURE O.3 Percentage of northern summers (June-July-August) warmer than the warmest 95th percentile
(1 in 20) for 1971-2000, for 2°C global average warming above the level of 1971-2000, or about 3°C total
warming since pre-industrial times, from an analysis of the multi-model CMIP3 (Coupled Model Intercom-
parison Project phase 3) ensemble. {4.5}
in the tropics than in the extratropics (this sensitivity may decrease some-
what as the warming progresses).
While changes in precipitation extremes
could lead to changes in flood frequency, the linkage between precipitation
changes and flooding will be modulated by interactions between precipita-
tion characteristics and river basin hydrology, the nature of which are not
yet well understood. {4.6}
Hurricanes and Typhoons
Averaged over the tropics as a whole, the number of tropical cyclones is
expected to decrease slightly or remain essentially unchanged. Models sug-
gest that the average intensity of tropical cyclones (as measured by the wind
speed) is likely to increase roughly by 1-4% per degree C global warming,
or by 3-12% per degree C for the cube of this wind speed, often taken as
a rough measure of the destructive potential of storm winds.
For the North
Atlantic, the changes in hurricane statistics are more uncertain than the global
values, depending in large part on the spatial structure of the warming of the
tropical oceans, and not just on the local warming in the Atlantic. Recent
models project future changes in the number of Atlantic hurricanes ranging