Environmental Engineering Reference
In-Depth Information
BOX S.1 GTC (GIGATON OF CARBON)
One gigaton of carbon is 1 billion tons of carbon, where “carbon” refers literally to the mass of
carbon,
not
the mass of a molecule as a whole (i.e., all the atoms), but just the mass of carbon
atoms.
Example:
Burning 1 gallon of gasoline emits approximately 19.6 lbs of CO
2
(
http://cdiac.ornl.gov/
pns/faq.html
), so if you assume a typical American vehicle gets 20 miles per gallon and it travels
15,000 miles per year, then the typical American vehicle emits about 1.8 tons of carbon per year.
Stated differently, about 550 million average American vehicles would emit 1 GtC per year.
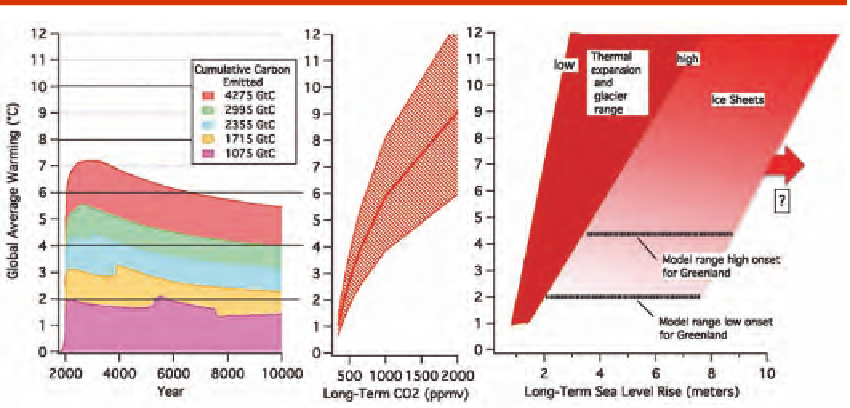
FIGURE S.3 Commitments to global warming over thousands of years, expressed as best estimates depend-
ing upon the cumulative anthropogenic carbon emitted (direct human emission plus possible induced
feedbacks such as release of carbon from clathrates, see below) by the end of the next few centuries from
a model study (left, from the calculations presented in Eby et al., 2009), the corresponding long-term carbon
dioxide concentrations, shown as best estimates and likely ranges (middle, from Table 3.1 of this report),
and estimated range of corresponding global average sea level rise (right, see Section 6.1; the adopted
equilibrium long-term thermal sea level rise is 0.2-0.6 m per degree as noted in Meehl et al., 2007). The
“low” and “high” onset values in the right panel reflect differences between available climate models in the
global mean temperature at which the Greenland ice sheet will disappear after thousands of years since the
accumulation cannot sustain the ice loss by melt in the ablation area and rapid ice flow-related loss along
the margins. This depends not only on increased ice loss from warming but also on increased accumula-
tion from greater snowfall in a warmer world, and the balance between these terms differs from model to
model. The range across models is taken from Meehl et al. (2007) based on a detailed analysis of the models
evaluated in the Intergovernmental Panel on Climate Change (IPCC) report. Additional contributions from
rapid ice discharge are possible (see Chapters 4 and 6). The climate sensitivity used to construct the likely
ranges shown in the middle panel is discussed in Chapter 3 where it is noted that larger or smaller warm-
ings than the estimated likely value for a given carbon dioxide concentration cannot be ruled out. Bumps
in the warming curves in the left panel are because of adjustments in ocean circulation in response to
warming in this particular climate model and should be thought of as illustrative only. {3.2, 6.1}