Environmental Engineering Reference
In-Depth Information
Emitted
to date
Global Mean Temperature Change (°C)
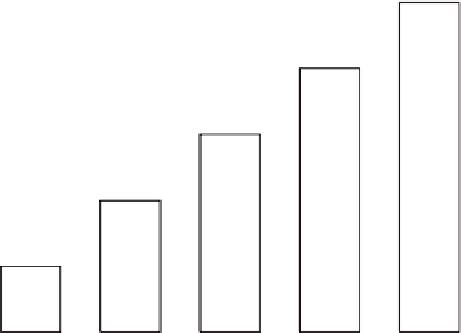
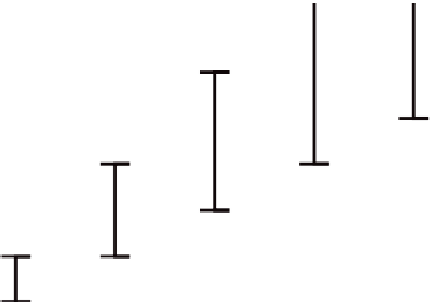
FIGURE S.2 (top) Best estimates and likely range of cumulative carbon emissions that would result in global
warming of 1°C, 2°C, 3°C, 4°C, or 5°C (see Figure S.1), based on recent studies that have demonstrated a near
linearity in the temperature response to cumulative emissions (see Section 3.4). Error bars reflect uncer-
tainty in carbon cycle and climate responses to CO
2
emissions, based on both observational constraints and
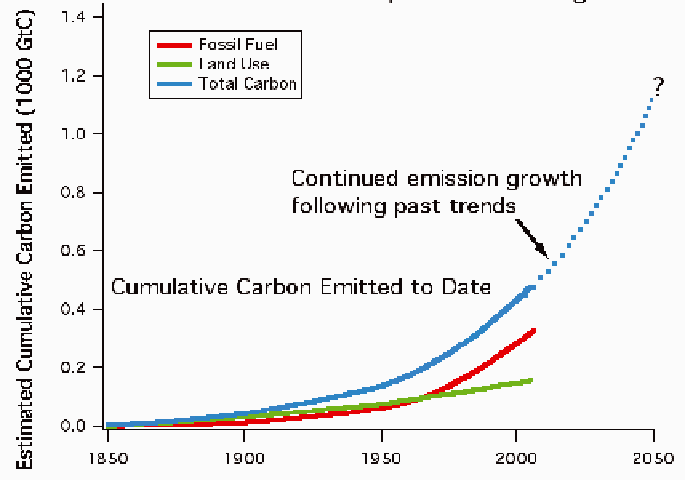
the range of climate-carbon cycle model results (see Section 3.4). (bottom) Estimated global cumulative
carbon emissions to date from fossil fuel burning and cement production, land use, and total. The figure
also shows how much cumulative carbon would be emitted by 2050 if past trends in emission growth rates
were to continue in the future, based upon a best fit to the past emission growth curve. {3.4}