Environmental Engineering Reference
In-Depth Information
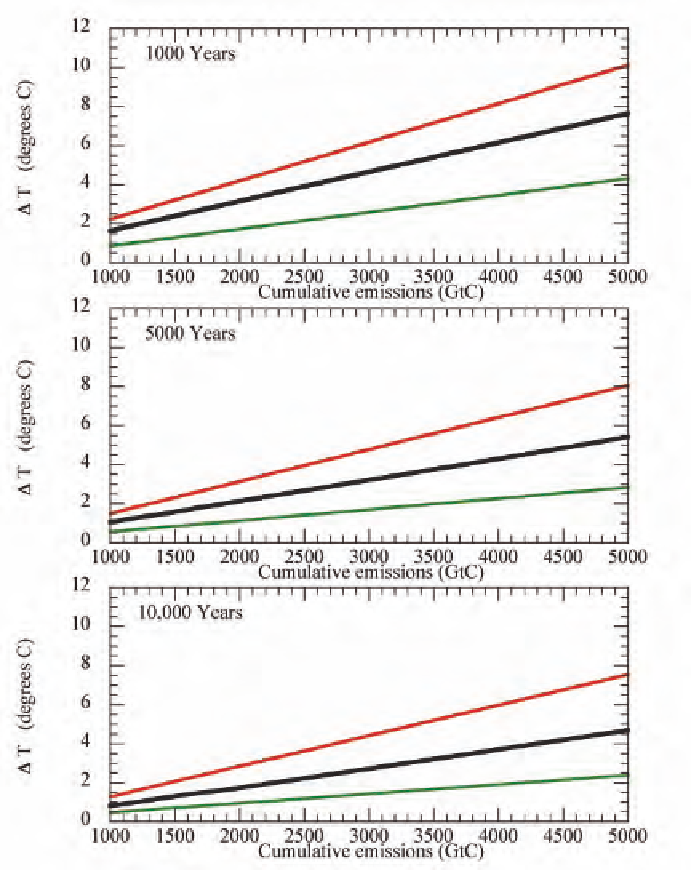
FIGURE 6.1 Range of very long-term warming obtained by applying the range of equilibrium climate sensi-
tivity in Table 3.1 to the LTMIP ensemble of carbon-cycle models discussed in Archer et al. (2009). The upper
red curve gives the maximum, the heavy black curve the median, and the lower green curve the minimum
warming over all combinations of climate sensitivity and carbon-cycle models. These results incorporate
the uptake of CO
2
by land and ocean, but do not include other Earth System Sensitivity feedbacks such as
vegetation change or ice sheet response. See Methods appendix for details of the calculation.