Environmental Engineering Reference
In-Depth Information
ranges of aggregate risk and more quantitative estimates only for specific
locations.
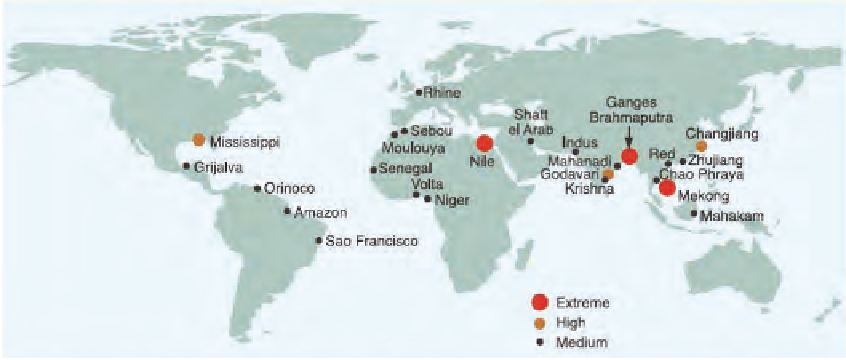
Figure 5.2 offers a portrait of the geographic spread of deltas and mega-
deltas where mega-cities are at the greatest risk from rising seas—these are
the “hot-spots” of “key vulnerabilities” in the coastal zone. Ericson et al.
(2006) estimated that nearly 300 million people currently inhabit a sample of
40 such deltas with an average population density of 500 people per km
2
.
Translating this observation into projections of future vulnerabilities,
Table 5.1 shows the sensitivity of estimates of populations subject to coastal
flooding in 2080 to assumptions about socioeconomic development as de-
scribed in the SRES scenarios—sensitivity generated by differences across
the scenarios in population growth and by differences in assumptions about
economic development and therefore the capacity to adapt. Figure 5.3 em-
phasizes the importance of adaptation when it suggests, for example that
1 m of sea level rise could put between 10 and 300 million more people
at risk of coastal flooding each year. It is important to note, in interpreting
this figure, that the likelihood of inundation from coastal storms may not be
proportional with sea level rise. Moreover, the consequences of these storm
events calibrated in millions of people in jeopardy from coastal flooding de-
pend on local population densities and geographic features. The result of the
FIGURE 5.2 Relative vulnerability of coastal deltas as shown by the indicative population displaced by
current sea-level trends to 2050 (Extreme=>1 million; High=1 million to 50,000; Medium=50,000 to 5,000;
following Ericson et al., 2006). Source: Nicholls et al. (2007: Figure 6.6).