Environmental Engineering Reference
In-Depth Information
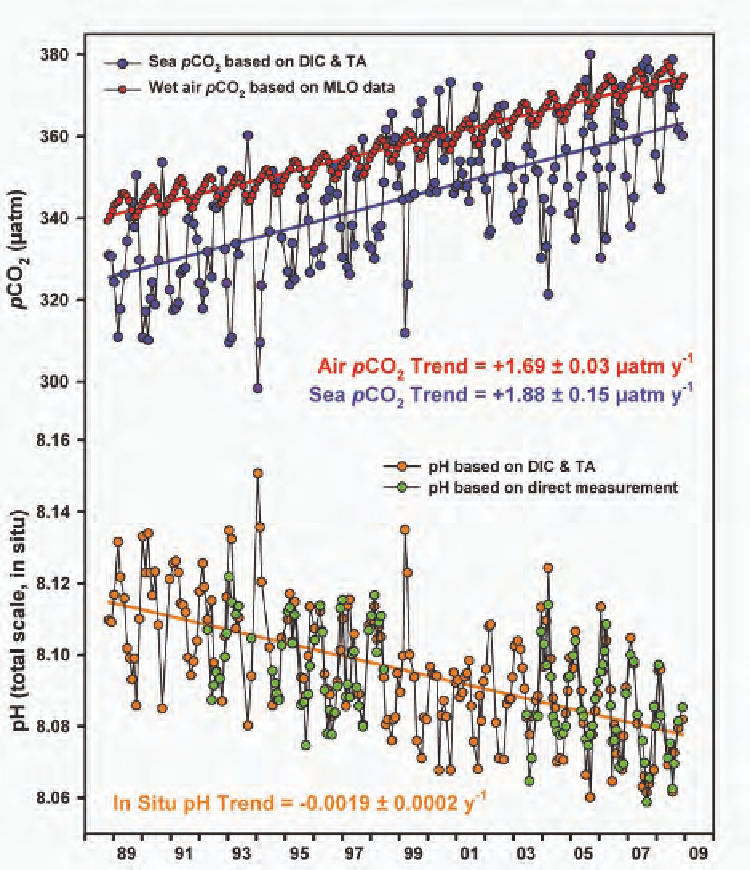
FIGURE 4.27 Time-series surface seawater carbonate system at Station ALOHA in the subtropical North
Pacific north of Hawai'i, 1988-2008. The upper panel displays the partial pressure of CO
2
(pCO
2
) in seawater
calculated from dissolved inorganic carbon (DIC) and total alkalinity (TA) (blue symbols) and in water-
saturated air at
in-situ
seawater temperature (red symbols). Atmospheric CO
2
data is from the Mauna Loa
Observatory, Hawai'i. The lower panel displays
in-situ
surface pH based on direct measurements (green
symbols) or as calculated from dissolved inorganic carbon and total alkalinity (orange symbols). Linear
regressions (colored lines) and regression equations are reported for each variable. Source: Adapted from
Dore et al. (2009).