Environmental Engineering Reference
In-Depth Information
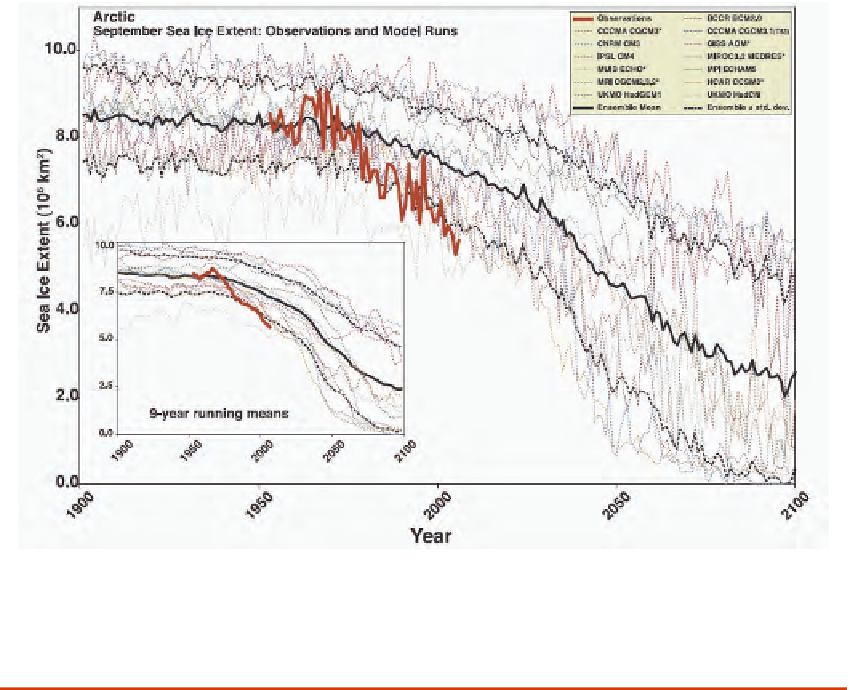
FIGURE 4.13 Arctic September sea-ice extent (× 10
6
km
2
) from observations (thick red line) and 13 IPCC
AR4 climate models, together with the multi-model ensemble mean (solid black line) and standard devia-
tion (dotted black line). Models with more than one ensemble member are indicated with an asterisk. Inset
shows 9-year running means. Source: Stroeve et al. (2007).
on the emission scenario used by the models but may also depend on the
natural variability simulated by the individual models. Figure 4.15 taken
from Wang and Overland (2009) illustrates this using six IPCC models that
simulate the observed mean minimum and seasonality of sea ice very well.
Two SRES scenarios are represented: the A1B, which reaches CO
2
concen-
tration of 720 ppm by the end of the 21st century, and A2, which reaches
850 ppm at the same time.
The predicted reduction in sea-ice extent is expected to be accompanied
by reduction in sea-ice thickness in summer and winter as more areas are
replaced by first year ice. Ice in the Northern Hemisphere is expected to thin
dramatically as the projected reduction in sea-ice volume is about twice that
of the sea-ice extent reduction. Using the same six models in Figure 4.15,
Wang and Overland (2009) compare the ice thickness at the time when the